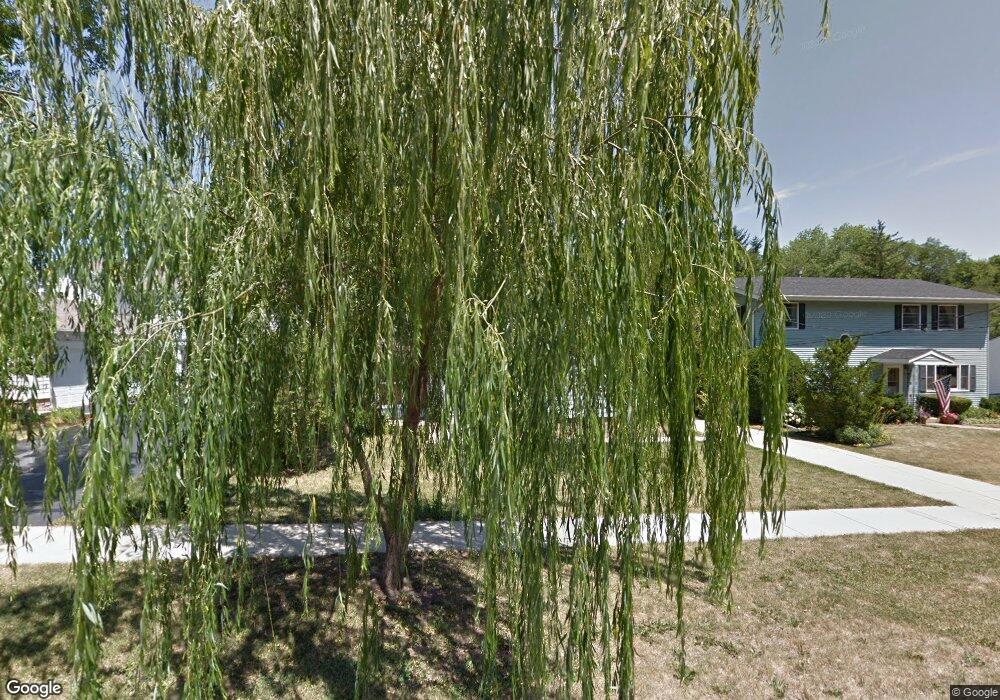
823 E Evergreen St Wheaton, IL 60187
Downtown Wheaton NeighborhoodEstimated Value: $325,608 - $362,000
2
Beds
1
Bath
960
Sq Ft
$361/Sq Ft
Est. Value
About This Home
This home is located at 823 E Evergreen St, Wheaton, IL 60187 and is currently estimated at $346,902, approximately $361 per square foot. 823 E Evergreen St is a home located in DuPage County with nearby schools including Lowell Elementary School, Franklin Middle School, and Wheaton North High School.
Ownership History
Date
Name
Owned For
Owner Type
Purchase Details
Closed on
Nov 20, 2020
Sold by
Bradley William W and Bradley Brenda K
Bought by
Watson Blake and Watson Rachael
Current Estimated Value
Home Financials for this Owner
Home Financials are based on the most recent Mortgage that was taken out on this home.
Original Mortgage
$176,000
Interest Rate
2.6%
Mortgage Type
New Conventional
Purchase Details
Closed on
Oct 5, 2018
Sold by
Dolphin Properties Llc Evergreen Series
Bought by
Bradley William W and Bradley Brenda K
Home Financials for this Owner
Home Financials are based on the most recent Mortgage that was taken out on this home.
Original Mortgage
$148,400
Interest Rate
5.37%
Mortgage Type
New Conventional
Purchase Details
Closed on
May 28, 2002
Sold by
Karbonek Theresa B
Bought by
Dolphin Properties Llc and Evergreen Series
Home Financials for this Owner
Home Financials are based on the most recent Mortgage that was taken out on this home.
Original Mortgage
$134,800
Interest Rate
5.75%
Create a Home Valuation Report for This Property
The Home Valuation Report is an in-depth analysis detailing your home's value as well as a comparison with similar homes in the area
Home Values in the Area
Average Home Value in this Area
Purchase History
| Date | Buyer | Sale Price | Title Company |
|---|---|---|---|
| Watson Blake | $220,000 | First American Title | |
| Bradley William W | -- | Fidelity National Title | |
| Dolphin Properties Llc | $168,500 | Burnet Title Llc |
Source: Public Records
Mortgage History
| Date | Status | Borrower | Loan Amount |
|---|---|---|---|
| Previous Owner | Watson Blake | $176,000 | |
| Previous Owner | Bradley William W | $148,400 | |
| Previous Owner | Dolphin Properties Llc | $134,800 |
Source: Public Records
Tax History
| Year | Tax Paid | Tax Assessment Tax Assessment Total Assessment is a certain percentage of the fair market value that is determined by local assessors to be the total taxable value of land and additions on the property. | Land | Improvement |
|---|---|---|---|---|
| 2024 | $5,343 | $90,899 | $35,438 | $55,461 |
| 2023 | $5,114 | $83,670 | $32,620 | $51,050 |
| 2022 | $5,062 | $79,090 | $30,830 | $48,260 |
| 2021 | $5,040 | $77,210 | $30,100 | $47,110 |
| 2020 | $5,450 | $76,490 | $29,820 | $46,670 |
| 2019 | $5,331 | $74,470 | $29,030 | $45,440 |
| 2018 | $5,505 | $76,010 | $29,280 | $46,730 |
| 2017 | $5,433 | $73,210 | $28,200 | $45,010 |
| 2016 | $5,372 | $70,280 | $27,070 | $43,210 |
| 2015 | $5,343 | $67,040 | $25,820 | $41,220 |
| 2014 | $5,244 | $64,680 | $21,970 | $42,710 |
| 2013 | $5,109 | $64,880 | $22,040 | $42,840 |
Source: Public Records
Map
Nearby Homes
- 510 S President St
- 1019 Pershing Ave
- 421 E Willow Ave
- 715 S Naperville Rd
- 502 S Summit St
- 1216 E Elm St
- 353 E Liberty Dr
- 123 S Blanchard St
- 1315 Underwood Terrace
- 1000 S Lorraine Rd Unit 214
- 840 Sheldon Ct Unit B
- 110 Travers Ave
- 1026 Briarcliffe Blvd
- 1344 S Lorraine Rd Unit C
- 1601 Castbourne Ct
- 312 E Lincoln Ave
- 522 S West St
- 1129 Rhodes Ct
- 1581 Groton Ln
- 185 N Ott Ave
- 819 E Evergreen St
- 903 E Evergreen St
- 813 E Evergreen St
- 907 E Evergreen St
- 809 E Evergreen St
- 822 E Indiana St
- 828 E Indiana St
- 816 E Evergreen St
- 822 E Evergreen St
- 826 E Evergreen St
- 913 E Evergreen St
- 904 E Indiana St
- 812 E Evergreen St
- 803 E Evergreen St
- 904 E Indiana St
- 808 E Indiana St
- 906 E Indiana St
- 900 E Indiana St
- 904 E Evergreen St
- 806 E Evergreen St
Your Personal Tour Guide
Ask me questions while you tour the home.