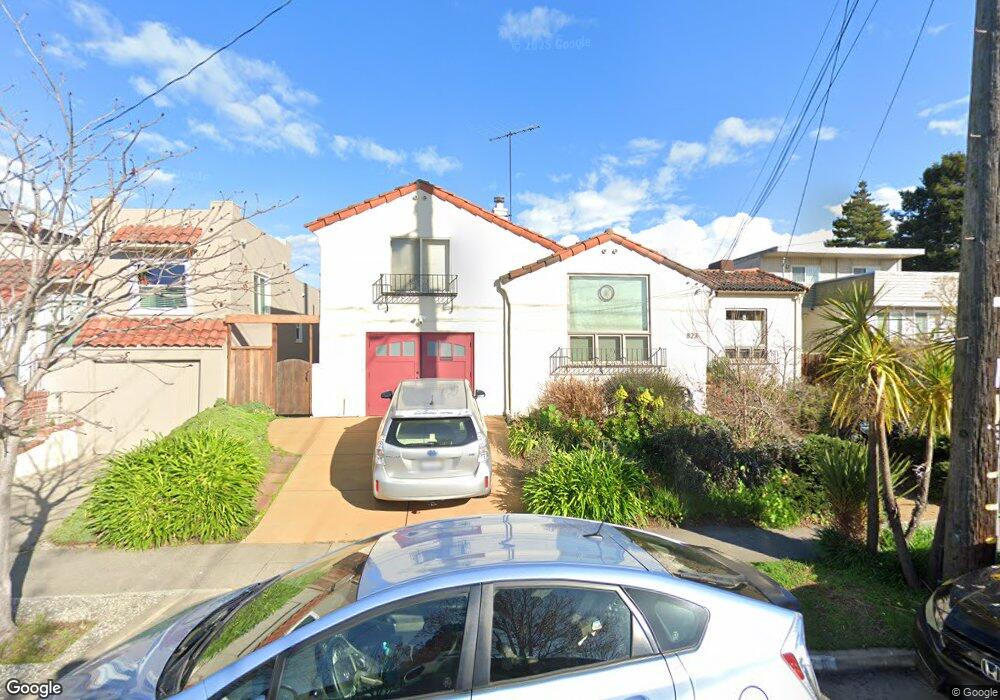
823 Key Route Blvd Albany, CA 94706
Estimated Value: $1,224,000 - $2,380,000
4
Beds
3
Baths
2,466
Sq Ft
$674/Sq Ft
Est. Value
About This Home
This home is located at 823 Key Route Blvd, Albany, CA 94706 and is currently estimated at $1,661,966, approximately $673 per square foot. 823 Key Route Blvd is a home located in Alameda County with nearby schools including Albany Middle School, Albany High School, and Tehiyah Day School.
Ownership History
Date
Name
Owned For
Owner Type
Purchase Details
Closed on
Jul 28, 2003
Sold by
Pressnall Robert A and Leung Charlene B
Bought by
Pressnall Robert A and Leung Charlene B
Current Estimated Value
Home Financials for this Owner
Home Financials are based on the most recent Mortgage that was taken out on this home.
Original Mortgage
$261,000
Outstanding Balance
$110,825
Interest Rate
5.13%
Mortgage Type
Purchase Money Mortgage
Estimated Equity
$1,551,141
Purchase Details
Closed on
Oct 23, 2001
Sold by
Pressnall Robert A and Leung Charlene B
Bought by
Pressnall Robert A and Leung Charlene B
Purchase Details
Closed on
Dec 6, 1993
Sold by
Ganoung Oliver E and Will Of Lillian Ganoung
Bought by
Pressnall Robert A and Leung Charlene B
Home Financials for this Owner
Home Financials are based on the most recent Mortgage that was taken out on this home.
Original Mortgage
$203,150
Interest Rate
6.89%
Create a Home Valuation Report for This Property
The Home Valuation Report is an in-depth analysis detailing your home's value as well as a comparison with similar homes in the area
Home Values in the Area
Average Home Value in this Area
Purchase History
| Date | Buyer | Sale Price | Title Company |
|---|---|---|---|
| Pressnall Robert A | -- | -- | |
| Pressnall Robert A | -- | Old Republic Title Company | |
| Pressnall Robert A | -- | -- | |
| Pressnall Robert A | $320,000 | Chicago Title Company |
Source: Public Records
Mortgage History
| Date | Status | Borrower | Loan Amount |
|---|---|---|---|
| Open | Pressnall Robert A | $261,000 | |
| Closed | Pressnall Robert A | $203,150 |
Source: Public Records
Tax History Compared to Growth
Tax History
| Year | Tax Paid | Tax Assessment Tax Assessment Total Assessment is a certain percentage of the fair market value that is determined by local assessors to be the total taxable value of land and additions on the property. | Land | Improvement |
|---|---|---|---|---|
| 2025 | $13,166 | $633,184 | $163,161 | $477,023 |
| 2024 | $13,166 | $620,633 | $159,962 | $467,671 |
| 2023 | $12,124 | $615,328 | $156,826 | $458,502 |
| 2022 | $11,520 | $596,263 | $153,751 | $449,512 |
| 2021 | $11,306 | $584,437 | $150,737 | $440,700 |
| 2020 | $11,159 | $585,372 | $149,191 | $436,181 |
| 2019 | $10,928 | $573,895 | $146,266 | $427,629 |
| 2018 | $10,632 | $562,645 | $143,399 | $419,246 |
| 2017 | $10,386 | $551,616 | $140,588 | $411,028 |
| 2016 | $9,906 | $540,802 | $137,832 | $402,970 |
| 2015 | $9,307 | $532,681 | $135,762 | $396,919 |
| 2014 | $9,317 | $522,247 | $133,103 | $389,144 |
Source: Public Records
Map
Nearby Homes
- 840 Key Route Blvd
- 720 Key Route Blvd
- 848 Stannage Ave Unit 11
- 606 Masonic Ave
- 625 Stannage Ave
- 609 San Carlos Ave
- 1120 Garfield Ave
- 417 Evelyn Ave Unit 205
- 1126 Brighton Ave
- 518 Kains Ave Unit 103
- 951 Madison St
- 1054 Masonic Ave
- 1038 Cornell Ave
- 704 Madison St
- 1046 Santa fe Ave
- 1050 Kains Ave Unit 3(B1)
- 935 Hillside Ave
- 785 Taft Ave Unit 10
- 825 Key Route Blvd
- 819 Key Route Blvd
- 827 Key Route Blvd
- 817 Key Route Blvd
- 824 Pomona Ave
- 829 Key Route Blvd
- 826 Pomona Ave
- 822 Pomona Ave
- 813 Key Route Blvd
- 828 Pomona Ave
- 820 Pomona Ave
- 830 Pomona Ave
- 833 Key Route Blvd
- 811 Key Route Blvd
- 818 Pomona Ave
- 832 Pomona Ave
- 809 Key Route Blvd
- 835 Key Route Blvd
- 816 Pomona Ave
- 837 Key Route Blvd