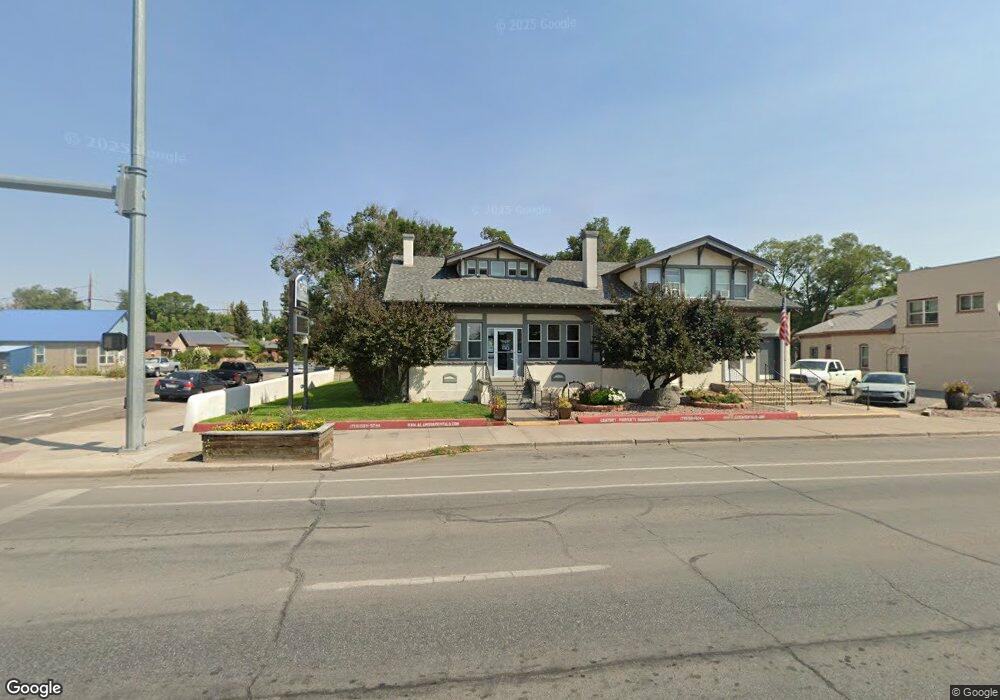
823 Main St Alamosa, CO 81101
Estimated Value: $308,000 - $664,000
6
Beds
2
Baths
3,202
Sq Ft
$145/Sq Ft
Est. Value
About This Home
This home is located at 823 Main St, Alamosa, CO 81101 and is currently estimated at $463,882, approximately $144 per square foot. 823 Main St is a home with nearby schools including Alamosa Elementary School, Ortega Middle School, and Alamosa High School.
Ownership History
Date
Name
Owned For
Owner Type
Purchase Details
Closed on
Apr 4, 2022
Sold by
Hill Vernon L
Bought by
Nonie Properties Llc
Current Estimated Value
Purchase Details
Closed on
Jul 21, 2010
Sold by
Smith Terryl J
Bought by
Mccarroll David and Mccarroll Darlene
Home Financials for this Owner
Home Financials are based on the most recent Mortgage that was taken out on this home.
Original Mortgage
$328,000
Interest Rate
4.73%
Mortgage Type
Purchase Money Mortgage
Purchase Details
Closed on
Dec 20, 1993
Sold by
Cowan Marshall M and Cowan Judith
Bought by
Smith Terryl J
Create a Home Valuation Report for This Property
The Home Valuation Report is an in-depth analysis detailing your home's value as well as a comparison with similar homes in the area
Purchase History
| Date | Buyer | Sale Price | Title Company |
|---|---|---|---|
| Nonie Properties Llc | $242,000 | Allpine Title | |
| Mccarroll David | $300,000 | None Available | |
| Smith Terryl J | $110,000 | -- |
Source: Public Records
Mortgage History
| Date | Status | Borrower | Loan Amount |
|---|---|---|---|
| Previous Owner | Mccarroll David | $328,000 |
Source: Public Records
Tax History
| Year | Tax Paid | Tax Assessment Tax Assessment Total Assessment is a certain percentage of the fair market value that is determined by local assessors to be the total taxable value of land and additions on the property. | Land | Improvement |
|---|---|---|---|---|
| 2024 | $2,243 | $42,402 | $15,485 | $26,917 |
| 2023 | $2,300 | $42,487 | $15,497 | $26,990 |
| 2022 | $3,169 | $40,410 | $13,573 | $26,837 |
| 2020 | $3,168 | $40,410 | $13,573 | $26,837 |
| 2019 | $3,178 | $39,364 | $13,573 | $25,791 |
| 2018 | $3,162 | $38,479 | $13,579 | $24,900 |
| 2017 | $3,167 | $38,479 | $13,579 | $24,900 |
| 2016 | $3,038 | $37,084 | $13,674 | $23,410 |
| 2015 | $304 | $37,084 | $13,674 | $23,410 |
| 2014 | -- | $37,208 | $13,674 | $23,534 |
| 2013 | -- | $37,208 | $13,674 | $23,534 |
Source: Public Records
Map
Nearby Homes
Your Personal Tour Guide
Ask me questions while you tour the home.