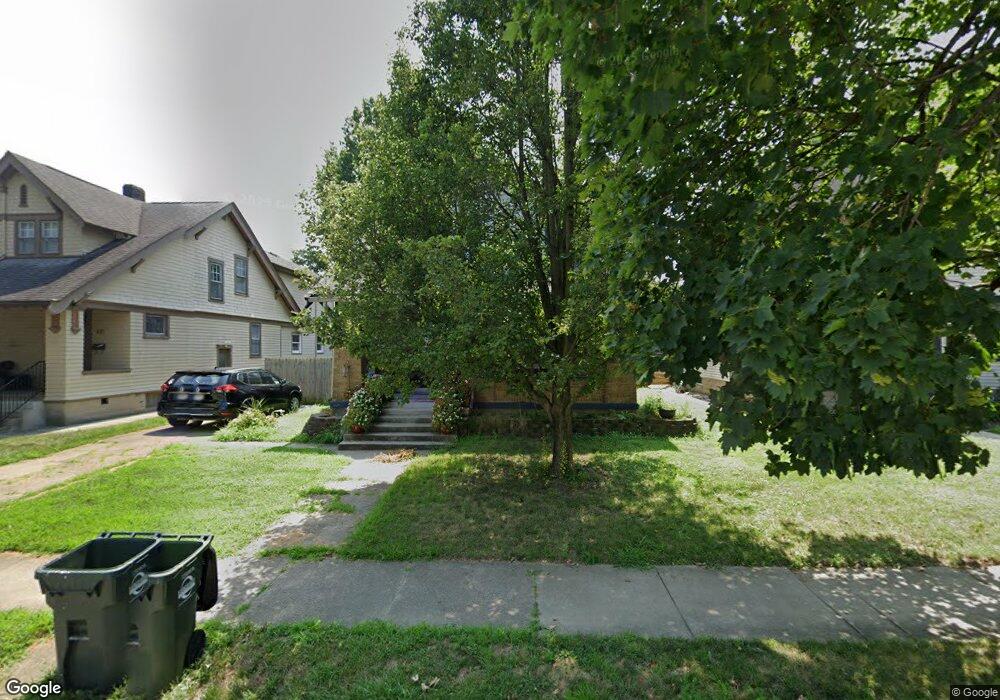
823 Main St Hamilton, OH 45013
Estimated Value: $161,000 - $253,000
3
Beds
2
Baths
1,820
Sq Ft
$116/Sq Ft
Est. Value
About This Home
This home is located at 823 Main St, Hamilton, OH 45013 and is currently estimated at $211,842, approximately $116 per square foot. 823 Main St is a home located in Butler County with nearby schools including Highland Elementary School, Wilson Middle School, and Hamilton High School Main Campus.
Ownership History
Date
Name
Owned For
Owner Type
Purchase Details
Closed on
Nov 4, 2024
Sold by
Bailey Lonnie D and Bailey Shelly K
Bought by
Bailey Shelly K
Current Estimated Value
Home Financials for this Owner
Home Financials are based on the most recent Mortgage that was taken out on this home.
Original Mortgage
$156,000
Outstanding Balance
$153,884
Interest Rate
6.32%
Mortgage Type
New Conventional
Estimated Equity
$57,958
Purchase Details
Closed on
Sep 13, 1999
Sold by
Stanger Earle Robert and Stanger Thelma L
Bought by
Bailey Lonnie D and Bailey Shelly K
Home Financials for this Owner
Home Financials are based on the most recent Mortgage that was taken out on this home.
Original Mortgage
$104,300
Interest Rate
7.12%
Mortgage Type
Purchase Money Mortgage
Create a Home Valuation Report for This Property
The Home Valuation Report is an in-depth analysis detailing your home's value as well as a comparison with similar homes in the area
Home Values in the Area
Average Home Value in this Area
Purchase History
| Date | Buyer | Sale Price | Title Company |
|---|---|---|---|
| Bailey Shelly K | -- | Vylla Title | |
| Bailey Shelly K | -- | Vylla Title | |
| Bailey Shelly K | -- | Vylla Title | |
| Bailey Lonnie D | $115,900 | -- |
Source: Public Records
Mortgage History
| Date | Status | Borrower | Loan Amount |
|---|---|---|---|
| Open | Bailey Shelly K | $156,000 | |
| Closed | Bailey Shelly K | $156,000 | |
| Previous Owner | Bailey Lonnie D | $104,300 |
Source: Public Records
Tax History
| Year | Tax Paid | Tax Assessment Tax Assessment Total Assessment is a certain percentage of the fair market value that is determined by local assessors to be the total taxable value of land and additions on the property. | Land | Improvement |
|---|---|---|---|---|
| 2025 | $2,192 | $51,950 | $8,620 | $43,330 |
| 2024 | $2,192 | $51,950 | $8,620 | $43,330 |
| 2023 | $2,182 | $51,950 | $8,620 | $43,330 |
| 2022 | $1,848 | $37,190 | $8,620 | $28,570 |
| 2021 | $1,630 | $35,980 | $8,620 | $27,360 |
| 2020 | $1,697 | $35,980 | $8,620 | $27,360 |
| 2019 | $2,379 | $32,490 | $8,180 | $24,310 |
| 2018 | $1,510 | $32,490 | $8,180 | $24,310 |
| 2017 | $1,523 | $32,490 | $8,180 | $24,310 |
| 2016 | $1,488 | $30,240 | $8,180 | $22,060 |
| 2015 | $1,479 | $30,240 | $8,180 | $22,060 |
| 2014 | $1,600 | $30,240 | $8,180 | $22,060 |
| 2013 | $1,600 | $32,540 | $8,180 | $24,360 |
Source: Public Records
Map
Nearby Homes
Your Personal Tour Guide
Ask me questions while you tour the home.