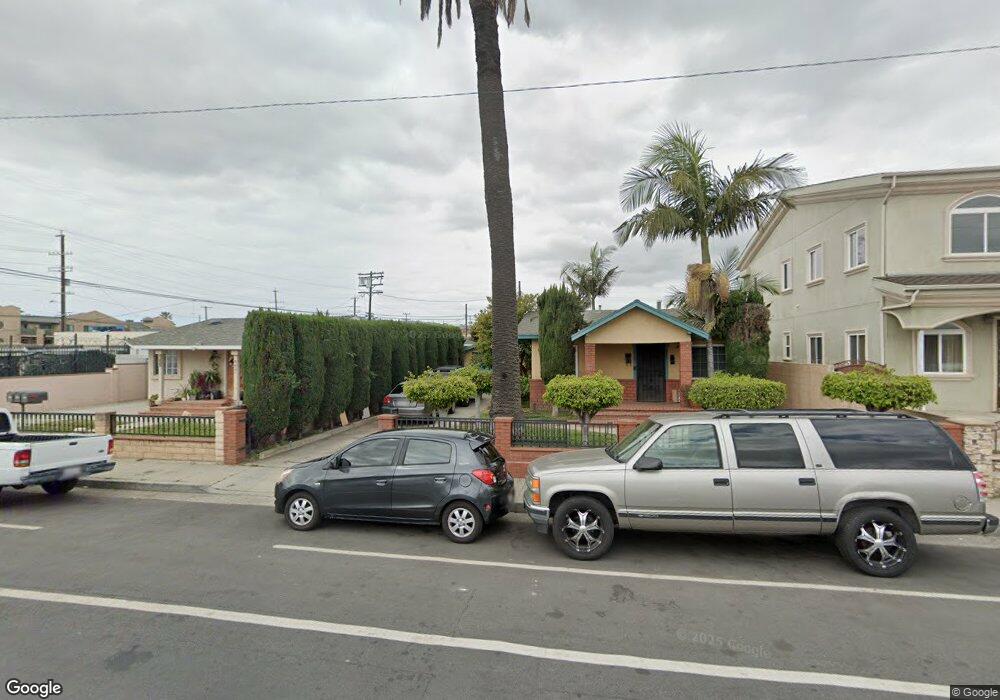
823 McDonald Ave Wilmington, CA 90744
Estimated Value: $728,000 - $828,000
5
Beds
3
Baths
1,956
Sq Ft
$395/Sq Ft
Est. Value
About This Home
This home is located at 823 McDonald Ave, Wilmington, CA 90744 and is currently estimated at $772,695, approximately $395 per square foot. 823 McDonald Ave is a home located in Los Angeles County with nearby schools including George De La Torre Jr. Elementary, Phineas Banning Senior High School, and Sts. Peter And St. Paul School.
Ownership History
Date
Name
Owned For
Owner Type
Purchase Details
Closed on
Mar 26, 2025
Sold by
Rosen Riki W and Wakeland Riki L
Bought by
Riki L Wakeland Trust and Wakeland
Current Estimated Value
Purchase Details
Closed on
Apr 3, 2017
Sold by
Tegel
Bought by
Tegel
Home Financials for this Owner
Home Financials are based on the most recent Mortgage that was taken out on this home.
Interest Rate
4.14%
Purchase Details
Closed on
Apr 11, 2001
Sold by
Saldana Jesus Hernandez
Bought by
Saldana J Carmen
Home Financials for this Owner
Home Financials are based on the most recent Mortgage that was taken out on this home.
Original Mortgage
$124,000
Interest Rate
6.98%
Purchase Details
Closed on
Feb 23, 1994
Sold by
Saldana J Carmen Hernandez
Bought by
Saldana J Carmen Hernandez and Saldana Jesus Hernandez
Create a Home Valuation Report for This Property
The Home Valuation Report is an in-depth analysis detailing your home's value as well as a comparison with similar homes in the area
Home Values in the Area
Average Home Value in this Area
Purchase History
| Date | Buyer | Sale Price | Title Company |
|---|---|---|---|
| Riki L Wakeland Trust | -- | None Listed On Document | |
| Tegel | -- | -- | |
| Saldana J Carmen | -- | Stewart Title | |
| Saldana J Carmen Hernandez | -- | Continental Land Title |
Source: Public Records
Mortgage History
| Date | Status | Borrower | Loan Amount |
|---|---|---|---|
| Previous Owner | Tegel | -- | |
| Previous Owner | Saldana J Carmen | $124,000 |
Source: Public Records
Tax History Compared to Growth
Tax History
| Year | Tax Paid | Tax Assessment Tax Assessment Total Assessment is a certain percentage of the fair market value that is determined by local assessors to be the total taxable value of land and additions on the property. | Land | Improvement |
|---|---|---|---|---|
| 2025 | $4,425 | $342,920 | $137,800 | $205,120 |
| 2024 | $4,425 | $336,198 | $135,099 | $201,099 |
| 2023 | $4,345 | $329,606 | $132,450 | $197,156 |
| 2022 | $4,152 | $323,144 | $129,853 | $193,291 |
| 2021 | $4,094 | $316,808 | $127,307 | $189,501 |
| 2020 | $4,130 | $313,560 | $126,002 | $187,558 |
| 2019 | $3,977 | $307,413 | $123,532 | $183,881 |
| 2018 | $3,884 | $301,386 | $121,110 | $180,276 |
| 2016 | $3,699 | $289,685 | $116,408 | $173,277 |
| 2015 | $3,648 | $285,335 | $114,660 | $170,675 |
| 2014 | $3,672 | $279,746 | $112,414 | $167,332 |
Source: Public Records
Map
Nearby Homes
- 827 McDonald Ave
- 817 McDonald Ave
- 831 McDonald Ave
- 833 McDonald Ave
- 837 McDonald Ave
- 826 McDonald Ave
- 820 Ronan Ave
- 814 Ronan Ave
- 824 Ronan Ave
- 830 Ronan Ave
- 822 McDonald Ave
- 810 W I St
- 826 McDonald Ave
- 818 McDonald Ave
- 832 McDonald Ave
- 836 Ronan Ave
- 818 W I St
- 838 McDonald Ave
- 822 W I St
- 824 W I St