Estimated Value: $176,000 - $245,000
3
Beds
2
Baths
1,461
Sq Ft
$144/Sq Ft
Est. Value
About This Home
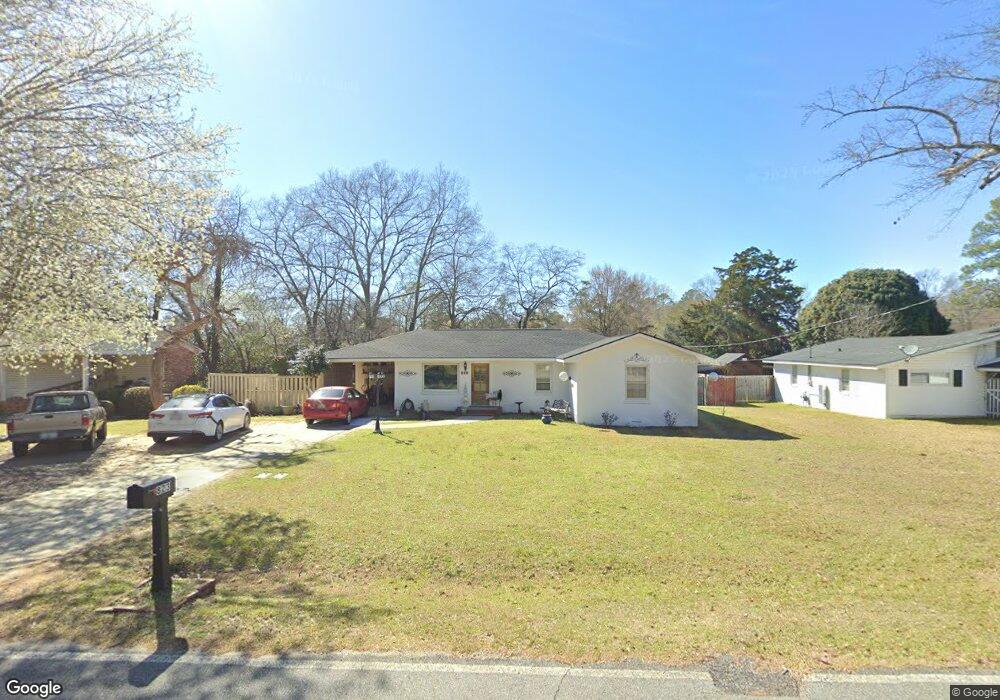
This home is located at 823 Moreland Ave, Perry, GA 31069 and is currently estimated at $209,845, approximately $143 per square foot. 823 Moreland Ave is a home located in Houston County with nearby schools including Tucker Elementary School, Perry Middle School, and Perry High School.
Ownership History
Date
Name
Owned For
Owner Type
Purchase Details
Closed on
Feb 23, 2001
Sold by
Hilton Catherine K and Hilton Keuper K
Bought by
Valdivia Billy D
Current Estimated Value
Purchase Details
Closed on
Oct 10, 2000
Sold by
Keuper Louise Estate
Bought by
Hilton Catherine K and Hilton Keuper K
Purchase Details
Closed on
Jun 27, 1997
Sold by
Keuper Louise H
Bought by
Hilton Catherine K and Hilton Keuper K
Purchase Details
Closed on
May 23, 1997
Sold by
Keuper Kenneth E Estate
Bought by
Keuper Louise H
Purchase Details
Closed on
Jan 24, 1985
Sold by
Seago Fred C and Seago Bobbie C
Bought by
Keuper Kenneth E and Keuper Louise
Purchase Details
Closed on
Jun 22, 1970
Sold by
Hackman Carl L
Bought by
Seago Fred C and Seago Bobbie C
Purchase Details
Closed on
Apr 2, 1966
Sold by
Murphy A L
Bought by
Hackman Carl L
Purchase Details
Closed on
Nov 18, 1961
Bought by
Murphy A L
Create a Home Valuation Report for This Property
The Home Valuation Report is an in-depth analysis detailing your home's value as well as a comparison with similar homes in the area
Home Values in the Area
Average Home Value in this Area
Purchase History
| Date | Buyer | Sale Price | Title Company |
|---|---|---|---|
| Valdivia Billy D | $83,000 | -- | |
| Hilton Catherine K | -- | -- | |
| Hilton Catherine K | -- | -- | |
| Keuper Louise H | -- | -- | |
| Keuper Kenneth E | -- | -- | |
| Seago Fred C | -- | -- | |
| Hackman Carl L | -- | -- | |
| Murphy A L | -- | -- |
Source: Public Records
Tax History Compared to Growth
Tax History
| Year | Tax Paid | Tax Assessment Tax Assessment Total Assessment is a certain percentage of the fair market value that is determined by local assessors to be the total taxable value of land and additions on the property. | Land | Improvement |
|---|---|---|---|---|
| 2024 | $1,937 | $52,720 | $7,200 | $45,520 |
| 2023 | $1,631 | $44,080 | $7,200 | $36,880 |
| 2022 | $944 | $41,040 | $7,200 | $33,840 |
| 2021 | $847 | $36,640 | $7,200 | $29,440 |
| 2020 | $825 | $35,520 | $7,200 | $28,320 |
| 2019 | $825 | $35,520 | $7,200 | $28,320 |
| 2018 | $825 | $35,520 | $7,200 | $28,320 |
| 2017 | $826 | $35,520 | $7,200 | $28,320 |
| 2016 | $827 | $35,520 | $7,200 | $28,320 |
| 2015 | $829 | $35,520 | $7,200 | $28,320 |
| 2014 | -- | $35,520 | $7,200 | $28,320 |
| 2013 | -- | $35,520 | $7,200 | $28,320 |
Source: Public Records
Map
Nearby Homes
- 625 Cooper St
- 1432 Duncan Ave
- 630 Pine Ridge St
- 1406 Main St
- 706 Hillcrest Ave
- 624 Pine Ridge St
- 606 Frank Satterfield Rd
- 1207 Tucker Rd
- 117 Constance Ct
- 1808 Ross St
- 903 Massee Ln
- 905 Massee Ln
- 118 Constance Ct
- 1405 Cambridge Rd
- 1152 Lovely Ln
- 0 Carroll Aly
- 1205 Morningside Dr
- 1212 Swift St
- 1207 Swift St
- 1802 Kings Chapel Rd