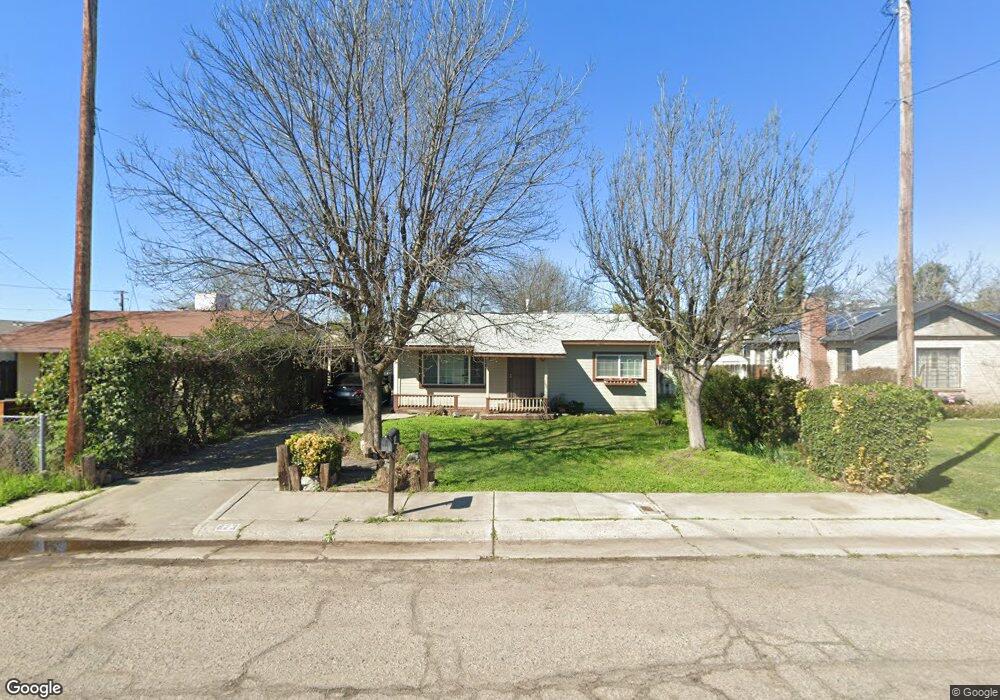
823 N Division St Porterville, CA 93257
Porterville Northeast NeighborhoodEstimated Value: $151,000 - $242,000
2
Beds
1
Bath
950
Sq Ft
$217/Sq Ft
Est. Value
About This Home
This home is located at 823 N Division St, Porterville, CA 93257 and is currently estimated at $206,552, approximately $217 per square foot. 823 N Division St is a home located in Tulare County with nearby schools including Los Robles Elementary School, Bartlett Middle School, and Granite Hills High School.
Ownership History
Date
Name
Owned For
Owner Type
Purchase Details
Closed on
Jul 21, 2011
Sold by
Symiczek June
Bought by
Dunn Charles Monty and Dunn Christy
Current Estimated Value
Purchase Details
Closed on
Aug 9, 2010
Sold by
Symiczek Donald G
Bought by
Symiczek June
Purchase Details
Closed on
Aug 22, 2005
Sold by
Lenhart Doris M and Lenhart Kenneth
Bought by
Symiczek June and Symiczek Donald G
Purchase Details
Closed on
Oct 8, 2004
Sold by
Symiczek Donald G
Bought by
Lenhart Doris M and Lenhart Kenneth
Home Financials for this Owner
Home Financials are based on the most recent Mortgage that was taken out on this home.
Original Mortgage
$35,000
Interest Rate
5.82%
Mortgage Type
Purchase Money Mortgage
Purchase Details
Closed on
May 24, 2002
Sold by
Nursery Chris Douglas
Bought by
Symiczek June
Purchase Details
Closed on
Nov 23, 1999
Sold by
Long Bill B
Bought by
Nursery Chris Douglas
Home Financials for this Owner
Home Financials are based on the most recent Mortgage that was taken out on this home.
Original Mortgage
$32,500
Interest Rate
7.84%
Mortgage Type
Seller Take Back
Purchase Details
Closed on
Mar 23, 1999
Sold by
Baez Pedro
Bought by
Long Bill B
Create a Home Valuation Report for This Property
The Home Valuation Report is an in-depth analysis detailing your home's value as well as a comparison with similar homes in the area
Home Values in the Area
Average Home Value in this Area
Purchase History
| Date | Buyer | Sale Price | Title Company |
|---|---|---|---|
| Dunn Charles Monty | -- | None Available | |
| Symiczek June | -- | None Available | |
| Symiczek June | -- | -- | |
| Lenhart Doris M | $48,000 | -- | |
| Symiczek June | $60,000 | Chicago Title Co | |
| Nursery Chris Douglas | $32,500 | -- | |
| Long Bill B | $23,520 | Land Title Insurance Co |
Source: Public Records
Mortgage History
| Date | Status | Borrower | Loan Amount |
|---|---|---|---|
| Previous Owner | Lenhart Doris M | $35,000 | |
| Previous Owner | Nursery Chris Douglas | $32,500 |
Source: Public Records
Tax History Compared to Growth
Tax History
| Year | Tax Paid | Tax Assessment Tax Assessment Total Assessment is a certain percentage of the fair market value that is determined by local assessors to be the total taxable value of land and additions on the property. | Land | Improvement |
|---|---|---|---|---|
| 2025 | $941 | $88,641 | $29,545 | $59,096 |
| 2024 | $941 | $86,904 | $28,966 | $57,938 |
| 2023 | $941 | $85,201 | $28,399 | $56,802 |
| 2022 | $911 | $83,532 | $27,843 | $55,689 |
| 2021 | $901 | $81,894 | $27,297 | $54,597 |
| 2020 | $891 | $81,054 | $27,017 | $54,037 |
| 2019 | $875 | $79,464 | $26,487 | $52,977 |
| 2018 | $860 | $77,906 | $25,968 | $51,938 |
| 2017 | $838 | $76,379 | $25,459 | $50,920 |
| 2016 | $742 | $69,000 | $17,000 | $52,000 |
| 2015 | $503 | $59,000 | $15,000 | $44,000 |
| 2014 | $503 | $47,000 | $12,000 | $35,000 |
Source: Public Records
Map
Nearby Homes
- 91 Heatherwood Ct
- 1105 N Scenic Dr
- 1070 N Highland Dr
- 0 N Marshall St
- 0 E Mulberry Ave
- 481 N Sunnyside St
- 917 N Esther St
- 0 N 2nd St
- 431 N Sunnyside St
- 361 W Grand Ave
- 459 N El Granito St
- 1495 N Highland Dr
- 0 N Scenic Dr Unit 237652
- 1167 N Main St
- 479 W Grand Ave
- 572 Memory Ln
- 1431 N Plano St
- 534 E Morton Ave
- 36 E Mill Ave
- 0 E Morton Unit 237726
- 815 N Division St
- 835 N Division St
- 12 W Henderson Ave
- 851 N Division St
- 850 N Lime St
- 832 N Lime St
- 816 N Division St
- 838 N Division St
- 867 N Division St
- 856 N Division St
- 870 N Lime St
- 834 N Division St
- 10 W Laurel Ave
- 34 W Laurel Ave
- 20 W Laurel Ave
- 6 W Laurel Ave
- 12 E Laurel Ave
- 26 W Laurel Ave
- 870 N Division St
- 881 N Division St