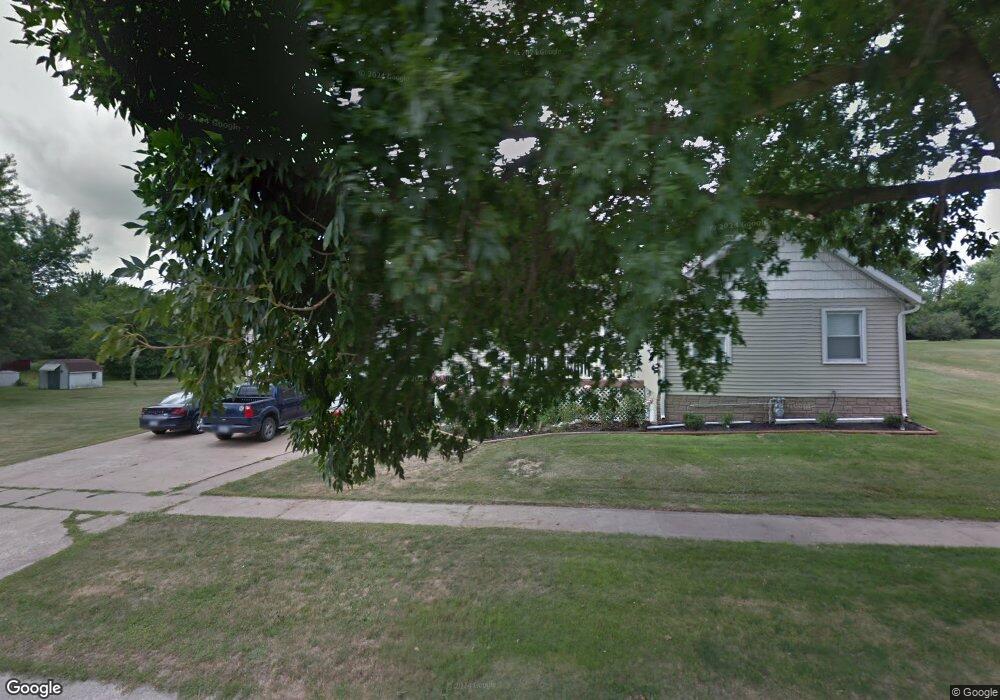
823 N E St Oskaloosa, IA 52577
Estimated Value: $181,000 - $237,303
3
Beds
2
Baths
1,544
Sq Ft
$139/Sq Ft
Est. Value
About This Home
This home is located at 823 N E St, Oskaloosa, IA 52577 and is currently estimated at $214,326, approximately $138 per square foot. 823 N E St is a home located in Mahaska County with nearby schools including Oskaloosa Preschool, Oskaloosa Elementary School, and Oskaloosa Middle School.
Ownership History
Date
Name
Owned For
Owner Type
Purchase Details
Closed on
Aug 26, 2011
Sold by
Kirby Dennis A
Bought by
Box Brian and Cook Julie
Current Estimated Value
Home Financials for this Owner
Home Financials are based on the most recent Mortgage that was taken out on this home.
Original Mortgage
$119,014
Outstanding Balance
$82,481
Interest Rate
4.59%
Mortgage Type
New Conventional
Estimated Equity
$131,845
Purchase Details
Closed on
Dec 27, 2005
Sold by
Hetherington Barbara and Hetherington Barbara Way
Bought by
Kirby Dennis A
Home Financials for this Owner
Home Financials are based on the most recent Mortgage that was taken out on this home.
Original Mortgage
$70,000
Interest Rate
6.48%
Mortgage Type
FHA
Create a Home Valuation Report for This Property
The Home Valuation Report is an in-depth analysis detailing your home's value as well as a comparison with similar homes in the area
Home Values in the Area
Average Home Value in this Area
Purchase History
| Date | Buyer | Sale Price | Title Company |
|---|---|---|---|
| Box Brian | $119,000 | None Available | |
| Kirby Dennis A | $60,000 | None Available |
Source: Public Records
Mortgage History
| Date | Status | Borrower | Loan Amount |
|---|---|---|---|
| Open | Box Brian | $119,014 | |
| Previous Owner | Kirby Dennis A | $70,000 |
Source: Public Records
Tax History Compared to Growth
Tax History
| Year | Tax Paid | Tax Assessment Tax Assessment Total Assessment is a certain percentage of the fair market value that is determined by local assessors to be the total taxable value of land and additions on the property. | Land | Improvement |
|---|---|---|---|---|
| 2025 | $2,550 | $177,010 | $31,860 | $145,150 |
| 2024 | $2,550 | $152,180 | $31,860 | $120,320 |
| 2023 | $2,758 | $152,180 | $31,860 | $120,320 |
| 2022 | $2,652 | $139,730 | $31,860 | $107,870 |
| 2021 | $2,640 | $139,730 | $31,860 | $107,870 |
| 2020 | $2,640 | $131,290 | $31,860 | $99,430 |
| 2019 | $2,568 | $127,540 | $0 | $0 |
| 2018 | $2,568 | $127,540 | $0 | $0 |
| 2017 | $2,474 | $120,970 | $0 | $0 |
| 2016 | $2,382 | $120,970 | $0 | $0 |
| 2015 | $2,306 | $120,970 | $0 | $0 |
| 2014 | $2,188 | $120,970 | $0 | $0 |
Source: Public Records
Map
Nearby Homes