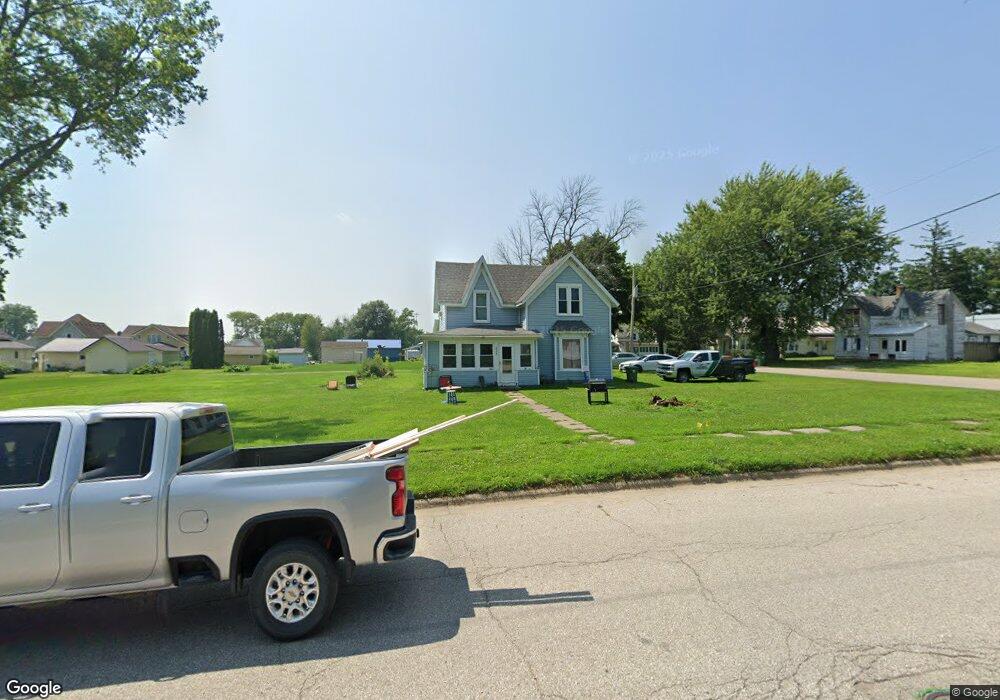
823 N Elm St Dumont, IA 50625
Estimated Value: $74,000 - $143,000
4
Beds
2
Baths
1,274
Sq Ft
$87/Sq Ft
Est. Value
About This Home
This home is located at 823 N Elm St, Dumont, IA 50625 and is currently estimated at $110,861, approximately $87 per square foot. 823 N Elm St is a home located in Butler County with nearby schools including North Side Elementary School, South Side Elementary School, and Hampton-Dumont Middle School.
Ownership History
Date
Name
Owned For
Owner Type
Purchase Details
Closed on
Sep 8, 2006
Sold by
Quint Jerald
Bought by
Hernandez Maria
Current Estimated Value
Home Financials for this Owner
Home Financials are based on the most recent Mortgage that was taken out on this home.
Original Mortgage
$67,500
Outstanding Balance
$40,359
Interest Rate
6.59%
Mortgage Type
New Conventional
Estimated Equity
$70,502
Purchase Details
Closed on
Aug 23, 2006
Sold by
Klahsen Tory J and Klahsen Jacqueline L
Bought by
Quint Jerald
Home Financials for this Owner
Home Financials are based on the most recent Mortgage that was taken out on this home.
Original Mortgage
$67,500
Outstanding Balance
$40,359
Interest Rate
6.59%
Mortgage Type
New Conventional
Estimated Equity
$70,502
Purchase Details
Closed on
May 10, 2005
Sold by
Ufford Daniel B
Bought by
Klahsen Tory J and Klahsen Jacqueline L
Create a Home Valuation Report for This Property
The Home Valuation Report is an in-depth analysis detailing your home's value as well as a comparison with similar homes in the area
Home Values in the Area
Average Home Value in this Area
Purchase History
| Date | Buyer | Sale Price | Title Company |
|---|---|---|---|
| Hernandez Maria | $67,500 | None Available | |
| Quint Jerald | $67,500 | None Available | |
| Klahsen Tory J | $17,500 | None Available |
Source: Public Records
Mortgage History
| Date | Status | Borrower | Loan Amount |
|---|---|---|---|
| Open | Hernandez Maria | $67,500 |
Source: Public Records
Tax History Compared to Growth
Tax History
| Year | Tax Paid | Tax Assessment Tax Assessment Total Assessment is a certain percentage of the fair market value that is determined by local assessors to be the total taxable value of land and additions on the property. | Land | Improvement |
|---|---|---|---|---|
| 2024 | $1,272 | $71,910 | $8,340 | $63,570 |
| 2023 | $1,104 | $71,910 | $8,340 | $63,570 |
| 2022 | $1,036 | $59,290 | $8,340 | $50,950 |
| 2021 | $990 | $59,290 | $8,340 | $50,950 |
| 2020 | $990 | $53,920 | $8,340 | $45,580 |
| 2019 | $858 | $49,890 | $8,340 | $45,580 |
| 2018 | $888 | $49,890 | $0 | $0 |
| 2017 | $888 | $49,890 | $0 | $0 |
| 2016 | $784 | $45,960 | $0 | $0 |
| 2015 | $784 | $45,960 | $0 | $0 |
| 2014 | $788 | $45,960 | $0 | $0 |
Source: Public Records
Map
Nearby Homes
- 919 Mcmanus St
- 902 W Broadway St
- 910 W Broadway St
- 923 Mcmanus St
- 923 Mcmanus St
- 911 N Elm St
- 910 Mcmanus St
- 902 N Elm St
- 946 W Broadway St
- 818 N Elm St
- 918 Mcmanus St
- 826 Willow St
- 924 W Broadway St
- 920 N Elm St
- 930 Mcmanus St
- 830 Broadway St
- 821 Willow St
- 927 N Elm St
- 929 Mcmanus St
- 930 W Broadway St