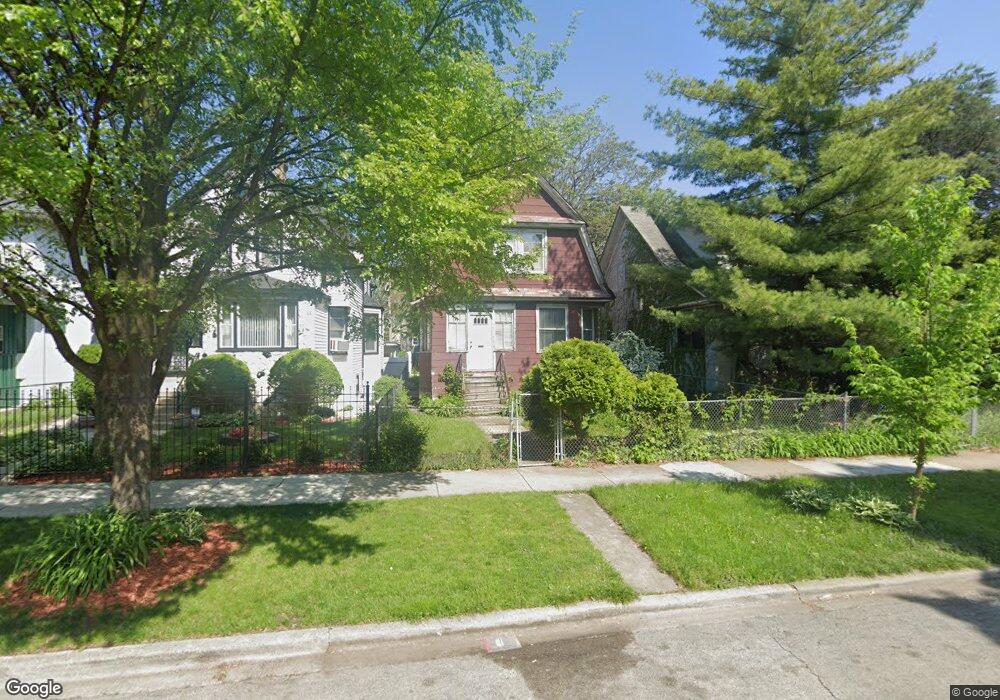
823 N Lorel Ave Chicago, IL 60651
Austin NeighborhoodEstimated Value: $209,000 - $315,000
3
Beds
2
Baths
1,608
Sq Ft
$163/Sq Ft
Est. Value
About This Home
This home is located at 823 N Lorel Ave, Chicago, IL 60651 and is currently estimated at $261,406, approximately $162 per square foot. 823 N Lorel Ave is a home located in Cook County with nearby schools including Howe School of Excellence, Orr Academy High School, and Moving Everest Charter School.
Ownership History
Date
Name
Owned For
Owner Type
Purchase Details
Closed on
Sep 1, 2002
Sold by
Gonzalez Ishmael and Gonzalez Donna
Bought by
Walker Frederick T
Current Estimated Value
Home Financials for this Owner
Home Financials are based on the most recent Mortgage that was taken out on this home.
Original Mortgage
$93,000
Outstanding Balance
$37,636
Interest Rate
6.34%
Estimated Equity
$223,770
Purchase Details
Closed on
Oct 4, 1996
Sold by
Freeman Donna and Gonzalez Donna
Bought by
Gonzalez Ishmad and Gonzalez Donna
Home Financials for this Owner
Home Financials are based on the most recent Mortgage that was taken out on this home.
Original Mortgage
$65,250
Interest Rate
12.5%
Purchase Details
Closed on
Mar 1, 1985
Sold by
Freeman Barnes
Bought by
Freeman Donna
Create a Home Valuation Report for This Property
The Home Valuation Report is an in-depth analysis detailing your home's value as well as a comparison with similar homes in the area
Home Values in the Area
Average Home Value in this Area
Purchase History
| Date | Buyer | Sale Price | Title Company |
|---|---|---|---|
| Walker Frederick T | $93,000 | Chicago Title Insurance Co | |
| Gonzalez Ishmad | -- | Chicago Title Insurance Co | |
| Freeman Donna | -- | -- |
Source: Public Records
Mortgage History
| Date | Status | Borrower | Loan Amount |
|---|---|---|---|
| Open | Walker Frederick T | $93,000 | |
| Previous Owner | Gonzalez Ishmad | $65,250 | |
| Closed | Gonzalez Ishmad | $6,050 |
Source: Public Records
Tax History
| Year | Tax Paid | Tax Assessment Tax Assessment Total Assessment is a certain percentage of the fair market value that is determined by local assessors to be the total taxable value of land and additions on the property. | Land | Improvement |
|---|---|---|---|---|
| 2025 | $2,676 | $19,700 | $5,467 | $14,233 |
| 2024 | $2,676 | $19,700 | $5,467 | $14,233 |
| 2023 | $2,587 | $16,000 | $4,328 | $11,672 |
| 2022 | $2,587 | $16,000 | $4,328 | $11,672 |
| 2021 | $2,548 | $15,999 | $4,328 | $11,671 |
| 2020 | $2,679 | $15,127 | $3,872 | $11,255 |
| 2019 | $2,688 | $16,808 | $3,872 | $12,936 |
| 2018 | $2,642 | $16,808 | $3,872 | $12,936 |
| 2017 | $2,165 | $13,433 | $3,417 | $10,016 |
| 2016 | $2,190 | $13,433 | $3,417 | $10,016 |
| 2015 | $1,981 | $13,433 | $3,417 | $10,016 |
| 2014 | $1,883 | $12,717 | $3,189 | $9,528 |
| 2013 | $1,835 | $12,717 | $3,189 | $9,528 |
Source: Public Records
Map
Nearby Homes
- 5348 W Chicago Ave
- 5256 W Chicago Ave
- 821 N Lockwood Ave
- 855 N Lockwood Ave
- 919 N Long Ave
- 912 N Latrobe Ave
- 844 N Laramie Ave
- 726 N Lotus Ave
- 635 N Lorel Ave
- 5444 W Walton St
- 655 N Lotus Ave
- 630 N Lorel Ave
- 5517 W Rice St
- 613 N Lorel Ave
- 736 N Pine Ave
- 611 N Long Ave
- 4646 W Ohio St
- 4644 W Ohio St
- 716 N Leclaire Ave
- 843 N Lorel Ave
- 819 N Lorel Ave
- 827 N Lorel Ave
- 829 N Lorel Ave
- 817 N Lorel Ave
- 833 N Lorel Ave
- 811 N Lorel Ave
- 837 N Lorel Ave
- 826 N Lockwood Ave
- 807 N Lorel Ave
- 816 N Lockwood Ave
- 816 N Lockwood Ave
- 839 N Lorel Ave
- 832 N Lockwood Ave
- 822 N Lockwood Ave
- 820 N Lockwood Ave
- 830 N Lorel Ave
- 822 N Lorel Ave
- 818 N Lorel Ave
- 826 N Lorel Ave
- 803 N Lorel Ave
Your Personal Tour Guide
Ask me questions while you tour the home.