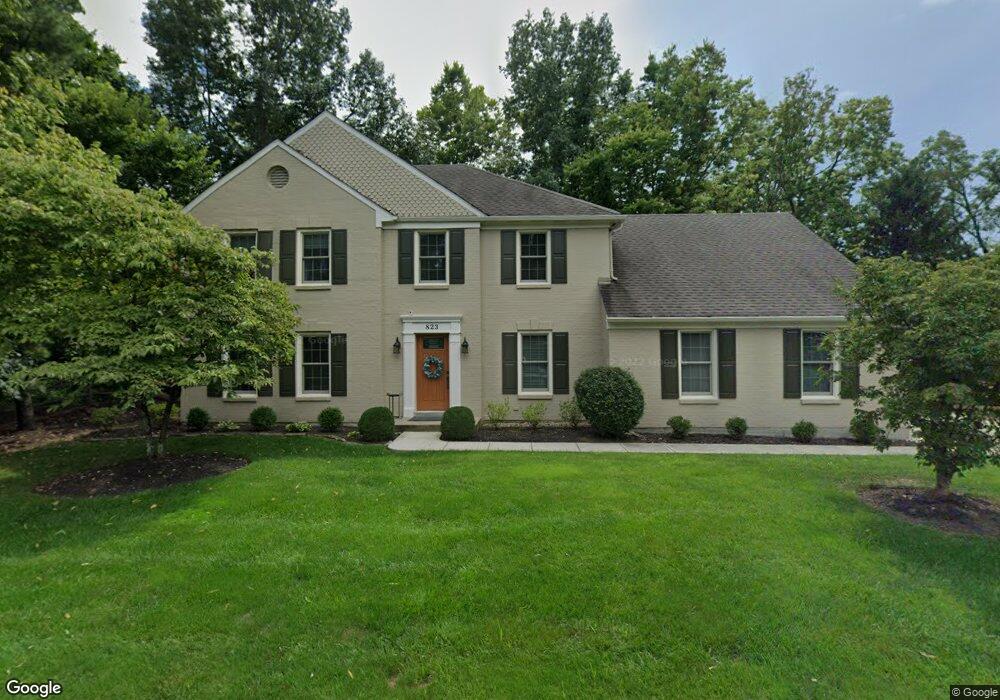
823 Shawnee Trace Ct Cincinnati, OH 45255
Estimated Value: $567,857 - $652,000
4
Beds
4
Baths
3,424
Sq Ft
$178/Sq Ft
Est. Value
About This Home
This home is located at 823 Shawnee Trace Ct, Cincinnati, OH 45255 and is currently estimated at $609,214, approximately $177 per square foot. 823 Shawnee Trace Ct is a home located in Hamilton County with nearby schools including Ayer Elementary School, Nagel Middle School, and Anderson High School.
Ownership History
Date
Name
Owned For
Owner Type
Purchase Details
Closed on
Nov 26, 2001
Sold by
Roudebush Derek S and Roudebush Jenni L
Bought by
Dye Donze M and Dye Patricia M
Current Estimated Value
Home Financials for this Owner
Home Financials are based on the most recent Mortgage that was taken out on this home.
Original Mortgage
$231,300
Outstanding Balance
$91,119
Interest Rate
6.68%
Estimated Equity
$518,095
Purchase Details
Closed on
Apr 23, 1998
Sold by
Settle V William H and Settle Susan K
Bought by
Krug John C
Home Financials for this Owner
Home Financials are based on the most recent Mortgage that was taken out on this home.
Original Mortgage
$219,600
Interest Rate
7.26%
Purchase Details
Closed on
Apr 22, 1998
Sold by
Krug John C
Bought by
Rodebush Derek S and Roudebush Jenni L
Home Financials for this Owner
Home Financials are based on the most recent Mortgage that was taken out on this home.
Original Mortgage
$219,600
Interest Rate
7.26%
Create a Home Valuation Report for This Property
The Home Valuation Report is an in-depth analysis detailing your home's value as well as a comparison with similar homes in the area
Home Values in the Area
Average Home Value in this Area
Purchase History
| Date | Buyer | Sale Price | Title Company |
|---|---|---|---|
| Dye Donze M | $289,200 | Vintage Title Agency Inc | |
| Krug John C | -- | -- | |
| Rodebush Derek S | $244,000 | -- |
Source: Public Records
Mortgage History
| Date | Status | Borrower | Loan Amount |
|---|---|---|---|
| Open | Dye Donze M | $231,300 | |
| Previous Owner | Rodebush Derek S | $219,600 |
Source: Public Records
Tax History
| Year | Tax Paid | Tax Assessment Tax Assessment Total Assessment is a certain percentage of the fair market value that is determined by local assessors to be the total taxable value of land and additions on the property. | Land | Improvement |
|---|---|---|---|---|
| 2025 | $9,976 | $159,506 | $13,962 | $145,544 |
| 2024 | $9,697 | $159,506 | $13,962 | $145,544 |
| 2023 | $9,223 | $159,506 | $13,962 | $145,544 |
| 2022 | $6,923 | $106,551 | $12,576 | $93,975 |
| 2021 | $6,761 | $106,551 | $12,576 | $93,975 |
| 2020 | $6,837 | $106,551 | $12,576 | $93,975 |
| 2019 | $6,664 | $94,294 | $11,130 | $83,164 |
| 2018 | $6,243 | $94,294 | $11,130 | $83,164 |
| 2017 | $5,889 | $94,294 | $11,130 | $83,164 |
| 2016 | $6,079 | $95,099 | $11,092 | $84,007 |
| 2015 | $5,904 | $95,099 | $11,092 | $84,007 |
| 2014 | $5,908 | $95,099 | $11,092 | $84,007 |
| 2013 | $5,701 | $97,041 | $11,319 | $85,722 |
Source: Public Records
Map
Nearby Homes
- 7754 Forest Rd
- 881 Asbury Rd
- 906 Woodlyn Dr N Unit 4
- 7924 Bar Harbor Dr
- 844 Woodlyn Dr S Unit 135
- 7926 Causeway Ln
- 965 Woodlyn Dr N
- 7978 Nagel Village Dr
- 771 Woodlyn Dr S Unit 190
- 559 Asbury Rd
- 7730 Arlington Ave
- 8016 Hignite Ct
- 937 Merritt Grove Ln
- 1013 Wittshire Ln
- 818 Rosetree Ln
- 1073 Wittshire Cir Unit 113
- 1125 Wittshire Ln Unit 130
- 7158 Dunn Rd
- 1357 Oak Ct
- 1363 Oak Ct
- 7706 Asbury Hills Dr
- 821 Shawnee Trace Ct
- 833 Shawnee Trace Ct
- 835 Shawnee Trace Ct
- 819 Shawnee Trace Ct
- 825 Shawnee Trace Ct
- 829 Shawnee Trace Ct
- 7714 Asbury Hills Dr
- 7700 Asbury Hills Dr
- 837 Shawnee Trace Ct
- 813 Shawnee Trace Ct
- 827 Shawnee Trace Ct
- 807 Shawnee Trace Ct
- 831 Shawnee Trace Ct
- 7701 Asbury Hills Dr
- 843 Shawnee Trace Ct
- 824 Shawnee Trace Ct
- 830 Shawnee Trace Ct
- 818 Shawnee Trace Ct
- 7715 Asbury Hills Dr
Your Personal Tour Guide
Ask me questions while you tour the home.