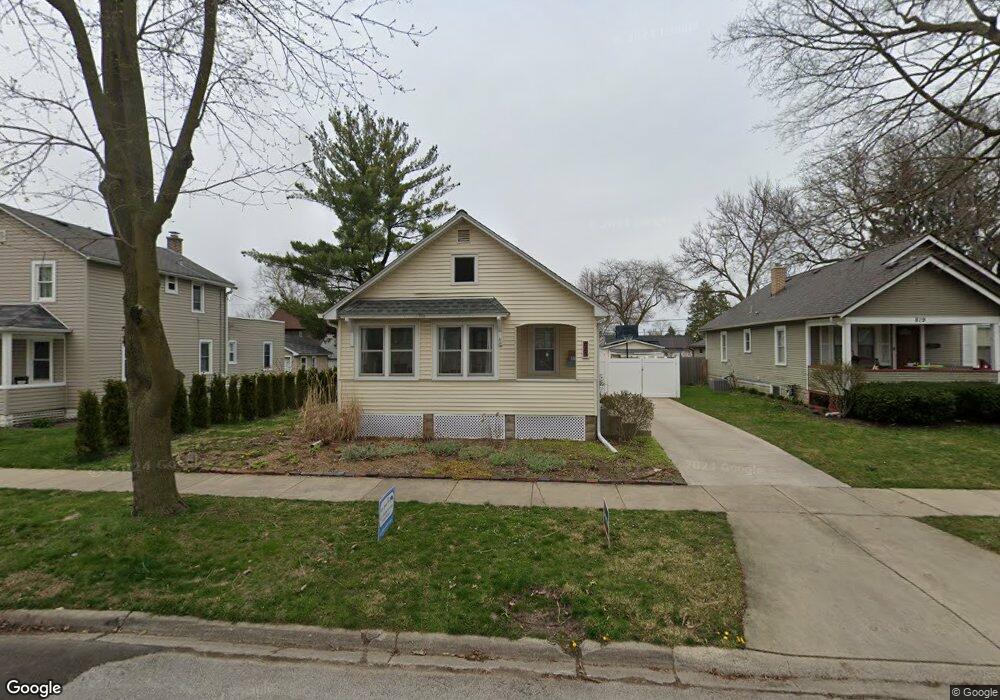
823 Spruce St Aurora, IL 60506
Blackhawk NeighborhoodEstimated Value: $193,000 - $269,000
3
Beds
1
Bath
941
Sq Ft
$244/Sq Ft
Est. Value
About This Home
This home is located at 823 Spruce St, Aurora, IL 60506 and is currently estimated at $229,935, approximately $244 per square foot. 823 Spruce St is a home located in Kane County with nearby schools including Greenman Elementary School, Jefferson Middle School, and West Aurora High School.
Ownership History
Date
Name
Owned For
Owner Type
Purchase Details
Closed on
Sep 29, 2008
Sold by
Newport Michael K and Newport Marianne C
Bought by
Kubicek Laura L and Kubicek Anthony J
Current Estimated Value
Home Financials for this Owner
Home Financials are based on the most recent Mortgage that was taken out on this home.
Original Mortgage
$105,200
Outstanding Balance
$69,956
Interest Rate
6.43%
Mortgage Type
Purchase Money Mortgage
Estimated Equity
$159,979
Purchase Details
Closed on
Oct 17, 2003
Sold by
Foster Bonnie L and Foster Daniel L
Bought by
Newport Michael K and Ledwick Marianne C
Home Financials for this Owner
Home Financials are based on the most recent Mortgage that was taken out on this home.
Original Mortgage
$115,963
Interest Rate
6.01%
Mortgage Type
FHA
Purchase Details
Closed on
Nov 21, 1997
Sold by
The Old Second National Bank Of Aurora
Bought by
Foster Lawrence D and Foster Elsie J
Create a Home Valuation Report for This Property
The Home Valuation Report is an in-depth analysis detailing your home's value as well as a comparison with similar homes in the area
Home Values in the Area
Average Home Value in this Area
Purchase History
| Date | Buyer | Sale Price | Title Company |
|---|---|---|---|
| Kubicek Laura L | $131,500 | Multiple | |
| Newport Michael K | $117,000 | Law Title Ins Co Inc | |
| Foster Lawrence D | -- | -- |
Source: Public Records
Mortgage History
| Date | Status | Borrower | Loan Amount |
|---|---|---|---|
| Open | Kubicek Laura L | $105,200 | |
| Previous Owner | Newport Michael K | $115,963 |
Source: Public Records
Tax History
| Year | Tax Paid | Tax Assessment Tax Assessment Total Assessment is a certain percentage of the fair market value that is determined by local assessors to be the total taxable value of land and additions on the property. | Land | Improvement |
|---|---|---|---|---|
| 2024 | $3,575 | $53,151 | $10,738 | $42,413 |
| 2023 | $3,382 | $47,490 | $9,594 | $37,896 |
| 2022 | $3,305 | $43,331 | $8,754 | $34,577 |
| 2021 | $3,138 | $40,342 | $8,150 | $32,192 |
| 2020 | $2,946 | $37,472 | $7,570 | $29,902 |
| 2019 | $2,808 | $34,719 | $7,014 | $27,705 |
| 2018 | $2,687 | $32,911 | $6,488 | $26,423 |
| 2017 | $2,305 | $28,400 | $5,978 | $22,422 |
| 2016 | $1,965 | $24,496 | $5,124 | $19,372 |
| 2015 | -- | $25,110 | $4,406 | $20,704 |
| 2014 | -- | $23,225 | $4,049 | $19,176 |
| 2013 | -- | $23,498 | $3,869 | $19,629 |
Source: Public Records
Map
Nearby Homes
- 810 W Galena Blvd
- 930 W New York St Unit 932
- 659 W Downer Place
- 932 W New York St
- 1039 S Pleasure Ct
- 523 N Highland Ave
- 109 N May St
- 514 Spruce St
- 1061 S Pleasure Ct
- 8 S Commonwealth Ave
- 507 W Park Ave
- 175 S Harrison Ave
- 603 N May St
- 160 Ingleside Ave
- 450 W Downer Place Unit 4C
- 415 Blackhawk St
- 214 S Fordham Ave
- 732 N Fordham Ave
- 837 Taylor Ave
- 847 Foran Ln
Your Personal Tour Guide
Ask me questions while you tour the home.