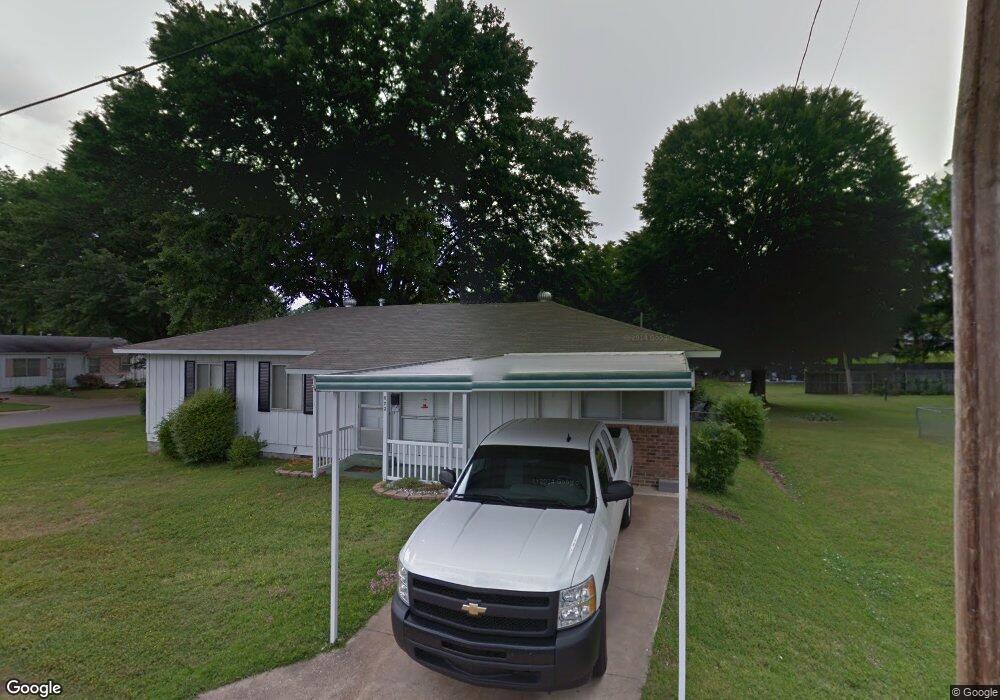
823 W Maple St Benton, AR 72015
Estimated Value: $160,472 - $180,000
Studio
2
Baths
1,300
Sq Ft
$129/Sq Ft
Est. Value
About This Home
This home is located at 823 W Maple St, Benton, AR 72015 and is currently estimated at $167,618, approximately $128 per square foot. 823 W Maple St is a home located in Saline County with nearby schools including Ringgold Elementary School, Benton Middle School, and Benton Junior High School.
Ownership History
Date
Name
Owned For
Owner Type
Purchase Details
Closed on
Sep 1, 2017
Sold by
Robins Gary D
Bought by
Baker Christy and Baker Tracy
Current Estimated Value
Home Financials for this Owner
Home Financials are based on the most recent Mortgage that was taken out on this home.
Original Mortgage
$104,080
Outstanding Balance
$86,847
Interest Rate
3.96%
Mortgage Type
FHA
Estimated Equity
$80,771
Purchase Details
Closed on
Jul 30, 2017
Sold by
Shelnut Diane and Shelnut Dowayne
Bought by
Robbins Gary D
Home Financials for this Owner
Home Financials are based on the most recent Mortgage that was taken out on this home.
Original Mortgage
$104,080
Outstanding Balance
$86,847
Interest Rate
3.96%
Mortgage Type
FHA
Estimated Equity
$80,771
Purchase Details
Closed on
Mar 4, 2003
Bought by
Robbins and Shelnut
Create a Home Valuation Report for This Property
The Home Valuation Report is an in-depth analysis detailing your home's value as well as a comparison with similar homes in the area
Home Values in the Area
Average Home Value in this Area
Purchase History
| Date | Buyer | Sale Price | Title Company |
|---|---|---|---|
| Baker Christy | $106,000 | First National Title Company | |
| Robbins Gary D | -- | None Available | |
| Robbins | -- | -- |
Source: Public Records
Mortgage History
| Date | Status | Borrower | Loan Amount |
|---|---|---|---|
| Open | Baker Christy | $104,080 |
Source: Public Records
Tax History
| Year | Tax Paid | Tax Assessment Tax Assessment Total Assessment is a certain percentage of the fair market value that is determined by local assessors to be the total taxable value of land and additions on the property. | Land | Improvement |
|---|---|---|---|---|
| 2025 | $1,110 | $20,034 | $4,680 | $15,354 |
| 2024 | $1,136 | $20,034 | $4,680 | $15,354 |
| 2023 | $1,039 | $20,034 | $4,680 | $15,354 |
| 2022 | $574 | $20,034 | $4,680 | $15,354 |
| 2021 | $529 | $16,310 | $3,600 | $12,710 |
| 2020 | $529 | $16,310 | $3,600 | $12,710 |
| 2019 | $529 | $16,310 | $3,600 | $12,710 |
| 2018 | $552 | $16,310 | $3,600 | $12,710 |
| 2017 | $447 | $16,310 | $3,600 | $12,710 |
| 2016 | $747 | $14,680 | $2,600 | $12,080 |
| 2015 | $384 | $14,680 | $2,600 | $12,080 |
| 2014 | $359 | $12,080 | $2,600 | $9,480 |
Source: Public Records
Map
Nearby Homes
- Lot 25 Lake St
- Lot 29R Lake St
- Lot 28 Lake St
- Lot 30R Lake St
- 517 Jefferson St
- 1500 W Sevier St
- 309 W Pine
- 408 W Sevier St
- 1026 Whitewood Dr
- 1212 Jackman St
- 301 W Pine
- 402 W Sevier St
- 402 S Market
- 721 W Narroway St
- 518 S Main
- 406 W Narroway St
- 722 S Market
- 324 W North St Unit 328
- 1108 Ike St
- 423 W Narroway St
Your Personal Tour Guide
Ask me questions while you tour the home.