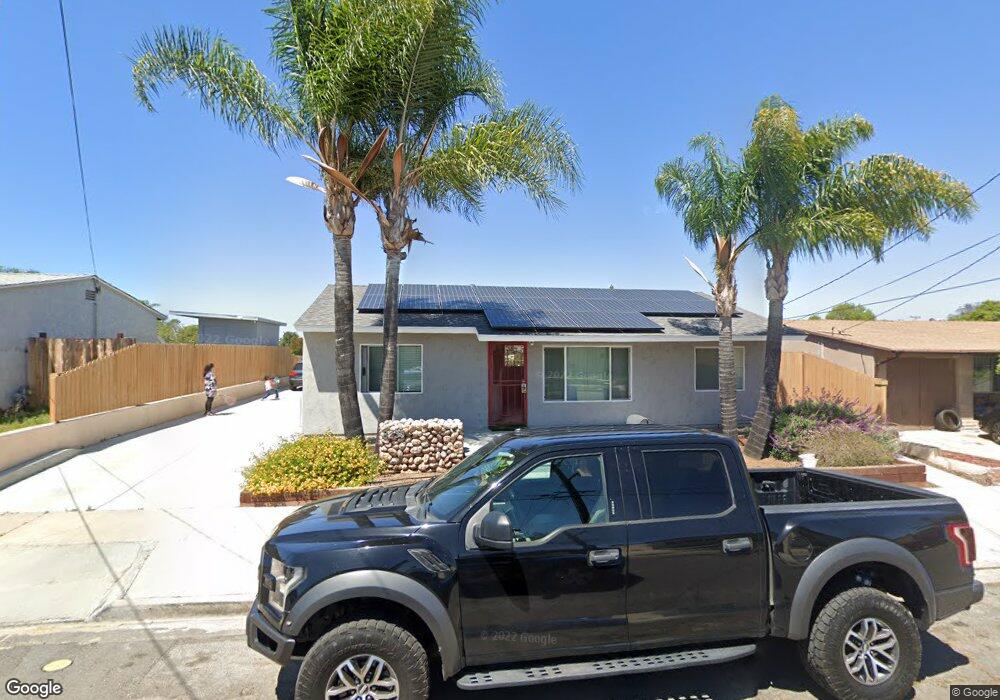
8230 Sabre St San Diego, CA 92114
Jamacha Lomita NeighborhoodEstimated Value: $629,000 - $693,083
2
Beds
1
Bath
750
Sq Ft
$899/Sq Ft
Est. Value
About This Home
This home is located at 8230 Sabre St, San Diego, CA 92114 and is currently estimated at $674,271, approximately $899 per square foot. 8230 Sabre St is a home located in San Diego County with nearby schools including Audubon K-8, Bell Middle School, and Morse High School.
Ownership History
Date
Name
Owned For
Owner Type
Purchase Details
Closed on
Sep 12, 2014
Sold by
Anderson Jason Michael and Bauzon Maria Menchita
Bought by
Anderson Jason Michal and Bauzon Maria Menchita
Current Estimated Value
Home Financials for this Owner
Home Financials are based on the most recent Mortgage that was taken out on this home.
Original Mortgage
$220,000
Outstanding Balance
$168,175
Interest Rate
4.1%
Mortgage Type
New Conventional
Estimated Equity
$506,096
Purchase Details
Closed on
Jun 10, 2011
Sold by
Wolff Robert D
Bought by
Anderson Jason Michael and Anderson Maria Menchita Bauzon
Home Financials for this Owner
Home Financials are based on the most recent Mortgage that was taken out on this home.
Original Mortgage
$164,131
Interest Rate
4.87%
Mortgage Type
FHA
Purchase Details
Closed on
Jan 28, 2010
Sold by
Wolff Carol Louise
Bought by
Wolff Robert D
Purchase Details
Closed on
Jan 27, 2010
Sold by
Torres Nohemi P
Bought by
Wolff Robert D
Purchase Details
Closed on
May 15, 2006
Sold by
Torres Jose and Torres Nohemi P
Bought by
Torres Nohemi P
Home Financials for this Owner
Home Financials are based on the most recent Mortgage that was taken out on this home.
Original Mortgage
$356,000
Interest Rate
6.37%
Mortgage Type
Purchase Money Mortgage
Purchase Details
Closed on
Jun 9, 2005
Sold by
Torres Nohemi P
Bought by
Torres Jose and Torres Nohemi P
Home Financials for this Owner
Home Financials are based on the most recent Mortgage that was taken out on this home.
Original Mortgage
$273,000
Interest Rate
5.75%
Mortgage Type
New Conventional
Purchase Details
Closed on
Jun 7, 2005
Sold by
Torres Jose
Bought by
Torres Nohemi P and Torres Noemi P
Home Financials for this Owner
Home Financials are based on the most recent Mortgage that was taken out on this home.
Original Mortgage
$273,000
Interest Rate
5.75%
Mortgage Type
New Conventional
Purchase Details
Closed on
Mar 13, 2002
Sold by
Martinez Jose and Martinez Martha
Bought by
Torres Jose and Torres Noemi P
Home Financials for this Owner
Home Financials are based on the most recent Mortgage that was taken out on this home.
Original Mortgage
$132,350
Interest Rate
6.84%
Purchase Details
Closed on
Apr 3, 1998
Sold by
Gargulinski Karl L
Bought by
Torres Jose and Torres Noemi P
Home Financials for this Owner
Home Financials are based on the most recent Mortgage that was taken out on this home.
Original Mortgage
$91,104
Interest Rate
7.07%
Mortgage Type
FHA
Purchase Details
Closed on
Mar 3, 1988
Purchase Details
Closed on
Apr 6, 1984
Create a Home Valuation Report for This Property
The Home Valuation Report is an in-depth analysis detailing your home's value as well as a comparison with similar homes in the area
Home Values in the Area
Average Home Value in this Area
Purchase History
| Date | Buyer | Sale Price | Title Company |
|---|---|---|---|
| Anderson Jason Michal | -- | None Available | |
| Anderson Jason Michael | $168,500 | California Title Company | |
| Wolff Robert D | -- | Lawyers Title Sd | |
| Wolff Robert D | $135,000 | Lawyers Title Sd | |
| Torres Nohemi P | -- | Ticor Title San Diego Branch | |
| Torres Jose | -- | Alliance Title Company | |
| Torres Nohemi P | -- | Alliance Title Company | |
| Torres Jose | -- | Placer Title Company | |
| Torres Jose | $91,500 | Chicago Title Co | |
| -- | $75,000 | -- | |
| -- | $61,500 | -- |
Source: Public Records
Mortgage History
| Date | Status | Borrower | Loan Amount |
|---|---|---|---|
| Open | Anderson Jason Michal | $220,000 | |
| Previous Owner | Anderson Jason Michael | $164,131 | |
| Previous Owner | Torres Nohemi P | $356,000 | |
| Previous Owner | Torres Nohemi P | $273,000 | |
| Previous Owner | Torres Jose | $132,350 | |
| Previous Owner | Torres Jose | $91,104 |
Source: Public Records
Tax History Compared to Growth
Tax History
| Year | Tax Paid | Tax Assessment Tax Assessment Total Assessment is a certain percentage of the fair market value that is determined by local assessors to be the total taxable value of land and additions on the property. | Land | Improvement |
|---|---|---|---|---|
| 2025 | $3,067 | $258,992 | $99,558 | $159,434 |
| 2024 | $3,067 | $253,914 | $97,606 | $156,308 |
| 2023 | $2,998 | $248,937 | $95,693 | $153,244 |
| 2022 | $2,916 | $244,057 | $93,817 | $150,240 |
| 2021 | $7,172 | $239,273 | $91,978 | $147,295 |
| 2020 | $7,106 | $236,820 | $91,035 | $145,785 |
| 2019 | $2,807 | $232,177 | $89,250 | $142,927 |
| 2018 | $2,624 | $227,625 | $87,500 | $140,125 |
| 2017 | $2,432 | $212,243 | $85,785 | $126,458 |
| 2016 | $2,276 | $198,278 | $84,103 | $114,175 |
| 2015 | $2,195 | $191,361 | $82,840 | $108,521 |
| 2014 | $2,160 | $187,614 | $81,218 | $106,396 |
Source: Public Records
Map
Nearby Homes
- 721 Cardiff St
- 612 Cardiff St
- 7936 Pala St
- 284 Middlebush Dr
- 249 Meadowbrook Dr
- 1277 Glencoe Dr
- 1011 Carlsbad St
- 8105 Dorchester St
- 8838 Ashmore Ave
- 101 Coolwater Dr
- 7420 Jamacha Rd
- 8118 Brampton St
- 1062 Armacost Rd
- 7853 Gribble St
- 366 Lausanne Dr
- 722 Osage St
- 1164 Woodrow Ave Unit 2
- 8828 Jaylee Ave
- 7358 Gribble St
- 351 Winewood St
- 8238 Sabre St
- 8220 Sabre St
- 8248 Sabre St
- 8212 Sabre St
- 8231 Sabre St
- 8223 Sabre St
- 8239 Sabre St
- 8215 Sabre St
- 8258 Sabre St
- 753 Jacumba St
- 763 Jacumba St
- 8249 Sabre St
- 745 Jacumba St
- 725 Jacumba St
- 8228 San Vicente St
- 8268 Sabre St
- 8220 San Vicente St
- 8259 Sabre St
- 8236 San Vicente St
- 8212 San Vicente St