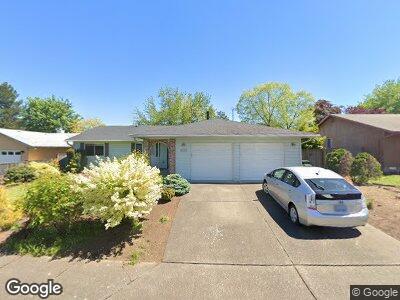
8230 SW Lori Way Beaverton, OR 97007
Sexton Mountain NeighborhoodEstimated Value: $527,000 - $629,000
3
Beds
2
Baths
1,554
Sq Ft
$373/Sq Ft
Est. Value
About This Home
This home is located at 8230 SW Lori Way, Beaverton, OR 97007 and is currently estimated at $579,802, approximately $373 per square foot. 8230 SW Lori Way is a home located in Washington County with nearby schools including Cooper Mountain Elementary School, Highland Park Middle School, and Mountainside High School.
Ownership History
Date
Name
Owned For
Owner Type
Purchase Details
Closed on
Jan 19, 2017
Sold by
Rd Development Llc
Bought by
Mcgee Ann and Austin Kathy Susan
Current Estimated Value
Home Financials for this Owner
Home Financials are based on the most recent Mortgage that was taken out on this home.
Original Mortgage
$194,000
Interest Rate
4.13%
Mortgage Type
New Conventional
Purchase Details
Closed on
Oct 13, 2016
Sold by
Clyde Robert
Bought by
Rd Development Llc
Purchase Details
Closed on
May 28, 2016
Sold by
Clyde Robert
Bought by
Rd Development
Purchase Details
Closed on
Jun 4, 2013
Sold by
Depew Harold and Depew Frances P
Bought by
Clyde Robert
Home Financials for this Owner
Home Financials are based on the most recent Mortgage that was taken out on this home.
Original Mortgage
$227,115
Interest Rate
3.37%
Mortgage Type
New Conventional
Create a Home Valuation Report for This Property
The Home Valuation Report is an in-depth analysis detailing your home's value as well as a comparison with similar homes in the area
Home Values in the Area
Average Home Value in this Area
Purchase History
| Date | Buyer | Sale Price | Title Company |
|---|---|---|---|
| Mcgee Ann | $393,000 | Fidelity Natl Title Oregon | |
| Rd Development Llc | $263,070 | None Available | |
| Rd Development | $1,000 | None Available | |
| Clyde Robert | $252,350 | Chicago Title Company Oregon |
Source: Public Records
Mortgage History
| Date | Status | Borrower | Loan Amount |
|---|---|---|---|
| Open | Mcgee Ann | $253,000 | |
| Closed | Mcgee Ann | $194,000 | |
| Previous Owner | Clyde Robert | $227,115 |
Source: Public Records
Tax History Compared to Growth
Tax History
| Year | Tax Paid | Tax Assessment Tax Assessment Total Assessment is a certain percentage of the fair market value that is determined by local assessors to be the total taxable value of land and additions on the property. | Land | Improvement |
|---|---|---|---|---|
| 2025 | $5,197 | $283,830 | -- | -- |
| 2024 | $4,882 | $275,570 | -- | -- |
| 2023 | $4,882 | $267,550 | $0 | $0 |
| 2022 | $4,711 | $267,550 | $0 | $0 |
| 2021 | $4,542 | $252,200 | $0 | $0 |
| 2020 | $4,404 | $244,860 | $0 | $0 |
| 2019 | $4,263 | $237,730 | $0 | $0 |
| 2018 | $4,124 | $230,810 | $0 | $0 |
| 2017 | $3,976 | $224,090 | $0 | $0 |
| 2016 | $3,477 | $197,100 | $0 | $0 |
| 2015 | $3,363 | $191,360 | $0 | $0 |
| 2014 | $3,302 | $185,790 | $0 | $0 |
Source: Public Records
Map
Nearby Homes
- 8273 SW Lori Way
- 8104 SW 159th Place
- 16679 SW Hargis Rd
- 16500 SW Satterberg Rd
- 8365 SW 158th Place
- 8754 SW Wakkila Terrace
- 15525 SW Hearth Ct
- 7556 SW Steinbach Terrace
- 16371 SW Horseshoe Way
- 7560 SW 157th Ave
- 8355 SW Sunstone Loop
- 15465 SW Gleneden Dr
- 8117 SW Charlotte Dr
- 7811 SW 171st Place
- 16454 SW Cornelian Way
- 16835 SW Tallac Way
- 8684 SW Muledeer Dr
- 7805 SW Gearhart Dr
- 8077 SW 174th Terrace
- 8415 SW 152nd Ave
- 8230 SW Lori Way
- 8242 SW Lori Way
- 8206 SW Lori Way
- 8225 SW 162nd Place
- 8205 SW 162nd Place
- 8172 SW Lori Way
- 8225 SW Lori Way
- 8258 SW Lori Way
- 8213 SW Lori Way
- 8237 SW Lori Way
- 8245 SW 162nd Place
- 8160 SW Lori Way
- 8249 SW Lori Way
- 8185 SW 162nd Place
- 8201 SW Lori Way
- 8261 SW Lori Way
- 8177 SW Lori Way
- 8146 SW Lori Way
- 8170 SW 165th Ave
- 8190 SW 165th Ave