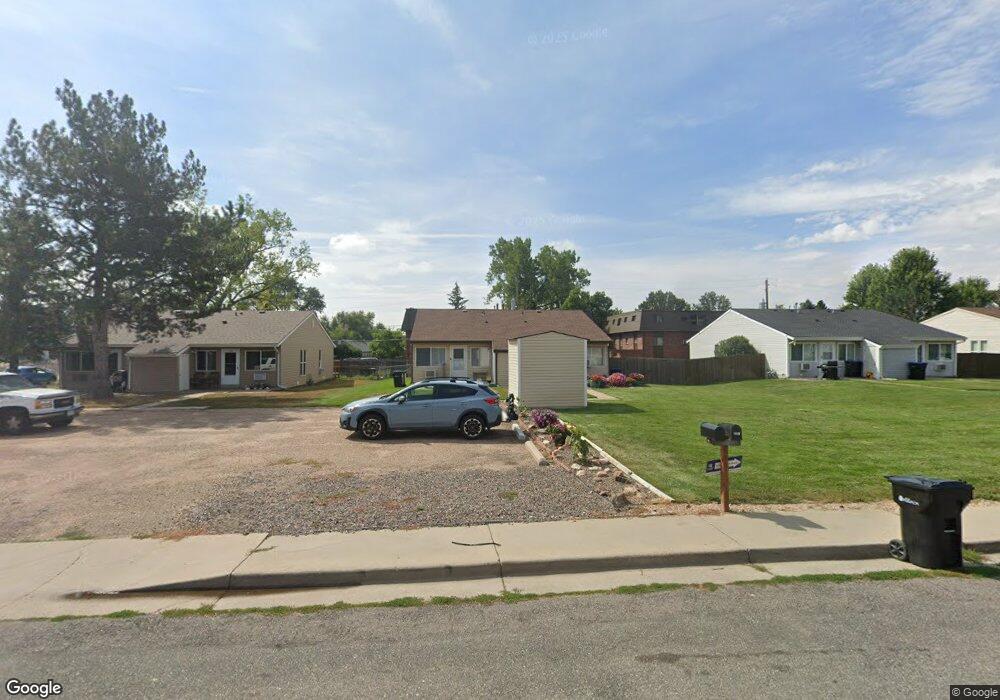
8230 W 54th Ave Arvada, CO 80002
Estimated Value: $600,000 - $621,320
4
Beds
2
Baths
1,782
Sq Ft
$342/Sq Ft
Est. Value
About This Home
This home is located at 8230 W 54th Ave, Arvada, CO 80002 and is currently estimated at $610,330, approximately $342 per square foot. 8230 W 54th Ave is a home located in Jefferson County with nearby schools including Lawrence Elementary School, Arvada K-8, and Arvada High School.
Ownership History
Date
Name
Owned For
Owner Type
Purchase Details
Closed on
Aug 19, 2019
Sold by
Pinson Kathryn L and Pinson Roger P
Bought by
Krp Investments Llc
Current Estimated Value
Purchase Details
Closed on
Sep 14, 2000
Sold by
Christine Ruffin Alexander J Ruffin
Bought by
Pinson Kathryn L and Pinson Roger P
Home Financials for this Owner
Home Financials are based on the most recent Mortgage that was taken out on this home.
Original Mortgage
$154,600
Interest Rate
7.97%
Purchase Details
Closed on
Aug 30, 1994
Sold by
Morin Dennis Rene and Morin Pamela Jane
Bought by
Ruffin Alexander J and Ruffin Christine
Home Financials for this Owner
Home Financials are based on the most recent Mortgage that was taken out on this home.
Original Mortgage
$82,260
Interest Rate
8.46%
Mortgage Type
FHA
Create a Home Valuation Report for This Property
The Home Valuation Report is an in-depth analysis detailing your home's value as well as a comparison with similar homes in the area
Home Values in the Area
Average Home Value in this Area
Purchase History
| Date | Buyer | Sale Price | Title Company |
|---|---|---|---|
| Krp Investments Llc | -- | None Available | |
| Pinson Kathryn L | $193,250 | -- | |
| Ruffin Alexander J | $82,500 | -- |
Source: Public Records
Mortgage History
| Date | Status | Borrower | Loan Amount |
|---|---|---|---|
| Previous Owner | Pinson Kathryn L | $154,600 | |
| Previous Owner | Ruffin Alexander J | $82,260 |
Source: Public Records
Tax History Compared to Growth
Tax History
| Year | Tax Paid | Tax Assessment Tax Assessment Total Assessment is a certain percentage of the fair market value that is determined by local assessors to be the total taxable value of land and additions on the property. | Land | Improvement |
|---|---|---|---|---|
| 2024 | $3,765 | $37,781 | $15,045 | $22,736 |
| 2023 | $3,765 | $37,781 | $15,045 | $22,736 |
| 2022 | $2,883 | $28,758 | $11,023 | $17,735 |
| 2021 | $2,991 | $30,239 | $11,591 | $18,648 |
| 2020 | $2,737 | $27,709 | $10,937 | $16,772 |
| 2019 | $2,701 | $27,709 | $10,937 | $16,772 |
| 2018 | $2,189 | $21,817 | $6,752 | $15,065 |
| 2017 | $2,006 | $21,817 | $6,752 | $15,065 |
| 2016 | $1,915 | $19,584 | $6,092 | $13,492 |
| 2015 | $1,535 | $19,584 | $6,092 | $13,492 |
| 2014 | $1,535 | $14,758 | $5,158 | $9,600 |
Source: Public Records
Map
Nearby Homes
- 5396 Balsam St
- 8237 W 54th Ave Unit 2
- 5402 Carr St Unit 102
- 5300 Balsam St
- 5290 Balsam St Unit 300004426
- 5419 Allison St Unit G
- 5223 Allison Way Unit D
- 5225 Balsam St Unit 1
- 5225 Balsam St Unit 5
- 5225 Balsam St Unit 7
- 5409 Zephyr Ct Unit 5409
- 8408 W 52nd Ave
- 5320 Allison St Unit 106
- 5465 Zephyr St Unit 201
- 5189 Carr St
- 8406 W 52nd Ave
- 8412 W 52nd Ave
- 7931 W 55th Ave Unit 308
- 8735 W 54th Place
- 8530 W 52nd Ave Unit A3
- 8250 W 54th Ave
- 8210 W 54th Ave
- 8270 W 54th Ave
- 8209 W 54th Ave Unit C
- 8209 W 54th Ave Unit B
- 8209 W 54th Ave Unit A
- 8209 W 54th Ave Unit APPROX
- 8310 W 54th Ave
- 5390 Balsam St
- 5370 Balsam St
- 8229 W 54th Ave Unit A
- 8229 W 54th Ave Unit B
- 8229 W 54th Ave Unit C
- 8229 W 54th Ave
- 8235 W 54th Ave Unit 1
- 5379 Balsam St
- 8239 W 54th Ave Unit 3
- 5363 Balsam St
- 8330 W 54th Ave
- 8219 W 54th Ave Unit C