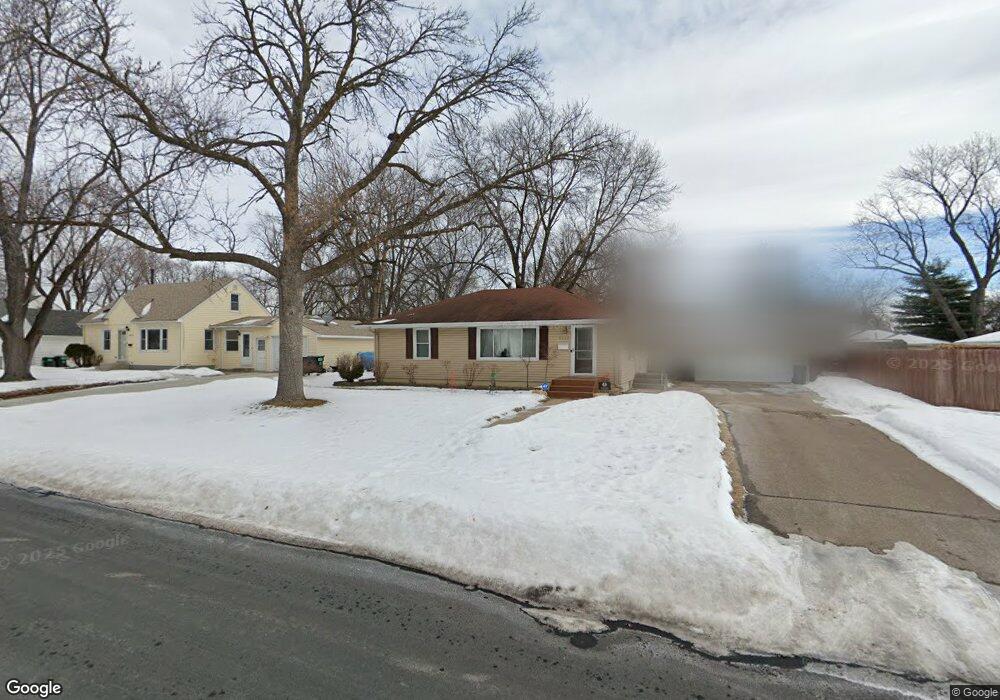
8233 Garfield Ave S Bloomington, MN 55420
East Bloomington NeighborhoodEstimated Value: $362,000 - $382,000
4
Beds
2
Baths
1,874
Sq Ft
$200/Sq Ft
Est. Value
About This Home
This home is located at 8233 Garfield Ave S, Bloomington, MN 55420 and is currently estimated at $374,022, approximately $199 per square foot. 8233 Garfield Ave S is a home located in Hennepin County with nearby schools including Poplar Bridge Elementary School, Valley View Middle School, and Kennedy Senior High School.
Ownership History
Date
Name
Owned For
Owner Type
Purchase Details
Closed on
Sep 2, 2020
Sold by
Oleson Craig L
Bought by
Underhill Larry W
Current Estimated Value
Home Financials for this Owner
Home Financials are based on the most recent Mortgage that was taken out on this home.
Original Mortgage
$310,000
Outstanding Balance
$275,104
Interest Rate
2.9%
Mortgage Type
VA
Estimated Equity
$98,918
Purchase Details
Closed on
Apr 13, 2017
Sold by
Hood Jeffrey and Hood Emil Y
Bought by
Oleson Craig L
Home Financials for this Owner
Home Financials are based on the most recent Mortgage that was taken out on this home.
Original Mortgage
$213,600
Interest Rate
4.1%
Mortgage Type
New Conventional
Purchase Details
Closed on
Oct 20, 2010
Sold by
Coen Broc and Coen Monica
Bought by
Hood Jeffery and Sirek Emily
Purchase Details
Closed on
Aug 16, 1999
Sold by
Warling Leona M
Bought by
Coen Broc D
Create a Home Valuation Report for This Property
The Home Valuation Report is an in-depth analysis detailing your home's value as well as a comparison with similar homes in the area
Home Values in the Area
Average Home Value in this Area
Purchase History
| Date | Buyer | Sale Price | Title Company |
|---|---|---|---|
| Underhill Larry W | $325,000 | Watermark Title Agency | |
| Oleson Craig L | $267,000 | None Available | |
| Hood Jeffery | $210,000 | -- | |
| Coen Broc D | $123,900 | -- |
Source: Public Records
Mortgage History
| Date | Status | Borrower | Loan Amount |
|---|---|---|---|
| Open | Underhill Larry W | $310,000 | |
| Previous Owner | Oleson Craig L | $213,600 |
Source: Public Records
Tax History Compared to Growth
Tax History
| Year | Tax Paid | Tax Assessment Tax Assessment Total Assessment is a certain percentage of the fair market value that is determined by local assessors to be the total taxable value of land and additions on the property. | Land | Improvement |
|---|---|---|---|---|
| 2024 | $506 | $338,900 | $106,700 | $232,200 |
| 2023 | $622 | $351,600 | $113,700 | $237,900 |
| 2022 | $0 | $347,100 | $113,700 | $233,400 |
| 2021 | $3,191 | $297,500 | $106,200 | $191,300 |
| 2020 | $3,191 | $256,200 | $103,200 | $153,000 |
| 2019 | $3,043 | $255,700 | $103,200 | $152,500 |
| 2018 | $2,996 | $241,000 | $100,800 | $140,200 |
| 2017 | $2,912 | $191,200 | $88,100 | $103,100 |
| 2016 | $2,721 | $169,100 | $79,900 | $89,200 |
| 2015 | $2,672 | $159,200 | $76,900 | $82,300 |
| 2014 | -- | $148,200 | $74,500 | $73,700 |
Source: Public Records
Map
Nearby Homes
- 8237 Pillsbury Ave S
- 8232 Wentworth Ave S
- 1008 W 80 1 2 St
- 8114 Emerson Ave S
- 1114 W 80th 1 2 St
- 8212 Fremont Ave S Unit D
- 8429 1st Ave S
- 8706 Aldrich Ave S
- 8331 3rd Ave S
- 7632 Aldrich Ave S
- 7639 Pillsbury Ave S
- 7615 Garfield Ave Unit 5
- 8101 Clinton Ave S
- 7600 Lyndale Ave S Unit 228
- 7600 Lyndale Ave S Unit 414
- 7600 Lyndale Ave S Unit 340
- 8345 Knox Ave S
- 7601 Aldrich Ave S Unit 405
- 7601 Aldrich Ave S Unit 407
- 7536 Colfax Ave S
- 8219 Garfield Ave S
- 8241 Garfield Ave S
- 8232 Harriet Ave S
- 8218 Harriet Ave S
- 500 W 83rd St
- 8232 Garfield Ave S
- 8214 Harriet Ave S
- 8240 Garfield Ave S
- 8226 Garfield Ave S
- 8301 Garfield Ave S
- 8209 Garfield Ave S
- 501 W 83rd St
- 8212 Garfield Ave S
- 8208 Harriet Ave S
- 8309 Garfield Ave S
- 8300 Garfield Ave S
- 8205 Garfield Ave S
- 8208 Garfield Ave S
- 8308 Harriet Ave S
- 8233 Lyndale Ave S