8235 E 148th Way Thornton, CO 80602
Heritage Todd Creek NeighborhoodEstimated Value: $590,878 - $604,000
2
Beds
2
Baths
1,680
Sq Ft
$355/Sq Ft
Est. Value
About This Home
This home is located at 8235 E 148th Way, Thornton, CO 80602 and is currently estimated at $595,720, approximately $354 per square foot. 8235 E 148th Way is a home located in Adams County with nearby schools including Brantner Elementary School, Rodger Quist Middle School, and Riverdale Ridge High School.
Ownership History
Date
Name
Owned For
Owner Type
Purchase Details
Closed on
Feb 19, 2025
Sold by
Harding Lawrence P and Harding Kathleen M
Bought by
Harding Family Trust and Harding
Current Estimated Value
Purchase Details
Closed on
Jun 9, 2006
Sold by
Lennar Colorado Llc
Bought by
Harding Lawrence P and Harding Kathleen M
Home Financials for this Owner
Home Financials are based on the most recent Mortgage that was taken out on this home.
Original Mortgage
$200,000
Interest Rate
6.56%
Mortgage Type
Fannie Mae Freddie Mac
Create a Home Valuation Report for This Property
The Home Valuation Report is an in-depth analysis detailing your home's value as well as a comparison with similar homes in the area
Home Values in the Area
Average Home Value in this Area
Purchase History
| Date | Buyer | Sale Price | Title Company |
|---|---|---|---|
| Harding Family Trust | -- | None Listed On Document | |
| Harding Lawrence P | $316,950 | North American Title |
Source: Public Records
Mortgage History
| Date | Status | Borrower | Loan Amount |
|---|---|---|---|
| Previous Owner | Harding Lawrence P | $200,000 |
Source: Public Records
Tax History
| Year | Tax Paid | Tax Assessment Tax Assessment Total Assessment is a certain percentage of the fair market value that is determined by local assessors to be the total taxable value of land and additions on the property. | Land | Improvement |
|---|---|---|---|---|
| 2025 | $3,454 | $37,060 | $7,820 | $29,240 |
| 2024 | $3,454 | $34,070 | $7,190 | $26,880 |
| 2023 | $3,444 | $34,300 | $6,770 | $27,530 |
| 2022 | $3,965 | $31,070 | $6,950 | $24,120 |
| 2021 | $3,892 | $31,070 | $6,950 | $24,120 |
| 2020 | $3,760 | $31,320 | $7,150 | $24,170 |
| 2019 | $3,752 | $31,320 | $7,150 | $24,170 |
| 2018 | $3,245 | $28,010 | $5,400 | $22,610 |
| 2017 | $3,235 | $28,010 | $5,400 | $22,610 |
| 2016 | $3,689 | $24,290 | $4,940 | $19,350 |
| 2015 | $3,684 | $24,290 | $4,940 | $19,350 |
| 2014 | -- | $22,030 | $2,950 | $19,080 |
Source: Public Records
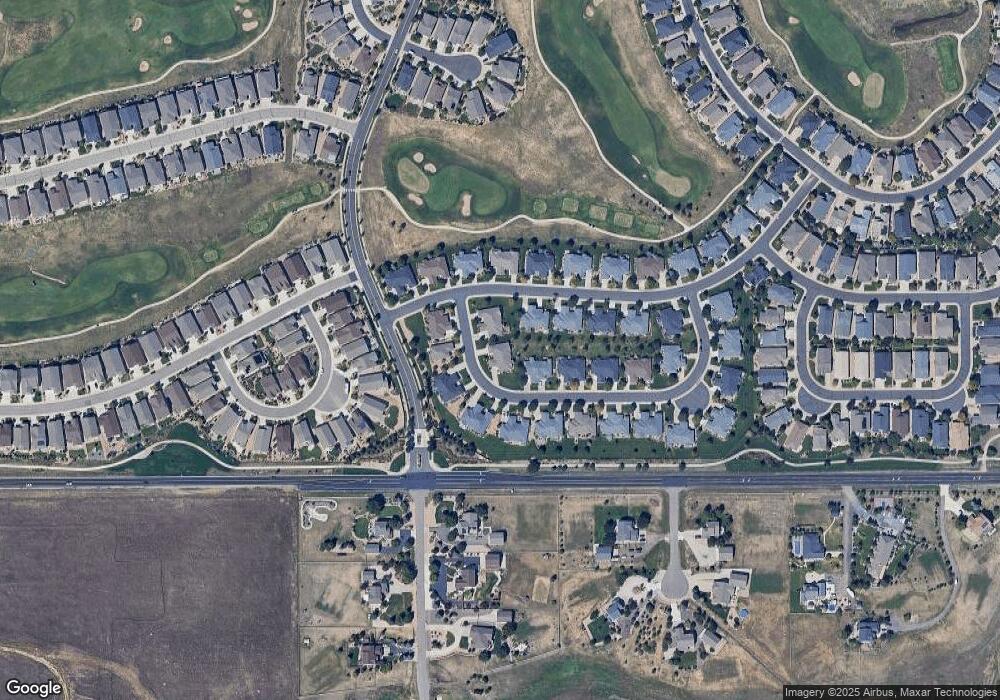
Map
Nearby Homes
- 8624 E 148th Cir
- 14887 Xenia St
- 15150 Verbena St
- 14925 Rosemary St
- 15235 Willow Dr
- 7516 E 148th Place
- 14683 Beeler St
- 7520 E 154th Ct
- 6974 E 149th Place
- 6984 E 149th Place
- 6934 E 149th Place
- 6904 E 149th Place
- 6914 E 149th Place
- 7130 E 152nd Ave
- 10512 E 152nd Ave
- 6969 Juniper Dr
- 6881 Arbor Blvd E
- 6949 Juniper Dr
- 6871 Arbor Blvd E
- 6880 Juniper Dr
- 8217 E 148th Way
- 8237 E 148th Way
- 8305 E 148th Way
- 8292 E 149th Dr
- 8307 E 148th Way
- 8256 E 148th Way
- 8258 E 148th Way
- 8276 E 148th Way
- 8278 E 148th Way
- 8215 E 148th Way
- 8294 E 149th Dr
- 8296 E 148th Way
- 8236 E 148th Way
- 8322 E 149th Dr
- 8325 E 148th Way
- 8206 E 148th Way
- 8327 E 148th Way
- 8208 E 148th Way
- 8298 E 148th Way
- 8324 E 149th Dr
Your Personal Tour Guide
Ask me questions while you tour the home.