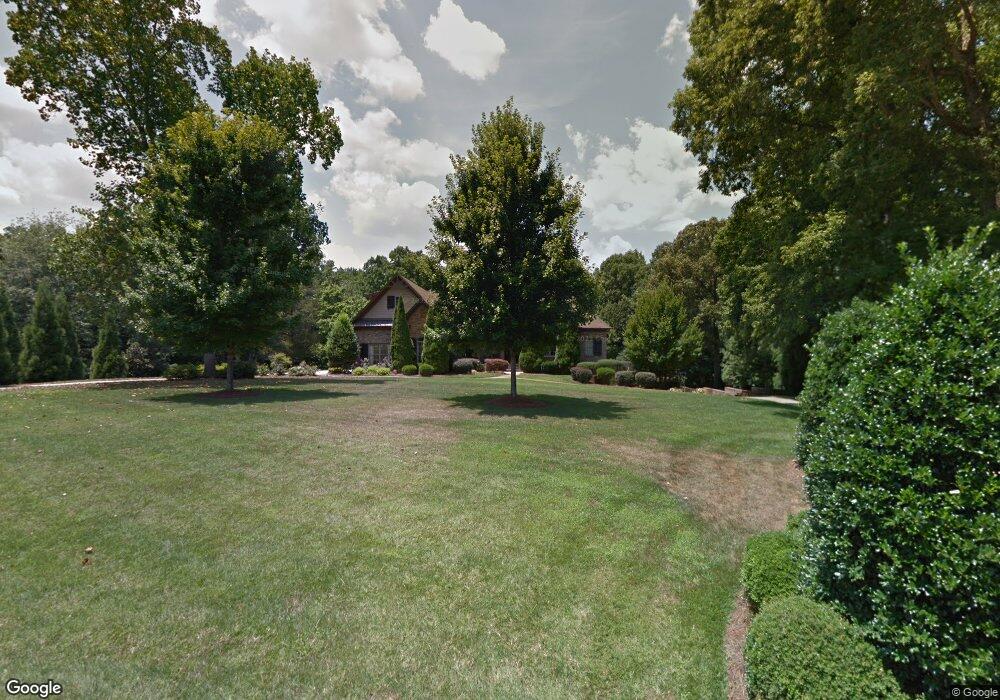
8235 Rolling Fields Rd Charlotte, NC 28227
Estimated Value: $980,000 - $1,066,000
4
Beds
4
Baths
3,888
Sq Ft
$267/Sq Ft
Est. Value
About This Home
This home is located at 8235 Rolling Fields Rd, Charlotte, NC 28227 and is currently estimated at $1,039,450, approximately $267 per square foot. 8235 Rolling Fields Rd is a home located in Mecklenburg County with nearby schools including Bain Elementary, Mint Hill Middle School, and Independence High.
Ownership History
Date
Name
Owned For
Owner Type
Purchase Details
Closed on
Nov 21, 2024
Sold by
Starnes James Anthony and Starnes June M
Bought by
Starnes Living Trust and Starnes
Current Estimated Value
Purchase Details
Closed on
Oct 23, 2023
Sold by
Johnny Edward Dill Revocable Trust
Bought by
Starnes James Anthony and Spouse June M
Purchase Details
Closed on
Jun 17, 2021
Sold by
Dill Johnny Edward and Andrews Dill Joan
Bought by
Dill Johnny Edward and Dill Johnny Edward
Purchase Details
Closed on
Dec 2, 2016
Sold by
Dill John and Andrews Dill Joan
Bought by
Dill Johnny Edward and Andrews Dill Joan
Purchase Details
Closed on
Jan 7, 2008
Sold by
The Home Group Inc
Bought by
Dill John and Andrews Dill Joan
Purchase Details
Closed on
Apr 23, 2007
Sold by
Plantation Falls Llc
Bought by
The Home Group Inc
Home Financials for this Owner
Home Financials are based on the most recent Mortgage that was taken out on this home.
Original Mortgage
$109,714
Interest Rate
6.11%
Mortgage Type
Construction
Create a Home Valuation Report for This Property
The Home Valuation Report is an in-depth analysis detailing your home's value as well as a comparison with similar homes in the area
Home Values in the Area
Average Home Value in this Area
Purchase History
| Date | Buyer | Sale Price | Title Company |
|---|---|---|---|
| Starnes Living Trust | -- | None Listed On Document | |
| Starnes James Anthony | $1,000,000 | Chicago Title | |
| Dill Johnny Edward | -- | None Available | |
| Dill Johnny Edward | -- | None Available | |
| Dill John | $689,500 | None Available | |
| The Home Group Inc | $212,000 | None Available |
Source: Public Records
Mortgage History
| Date | Status | Borrower | Loan Amount |
|---|---|---|---|
| Previous Owner | The Home Group Inc | $109,714 |
Source: Public Records
Tax History
| Year | Tax Paid | Tax Assessment Tax Assessment Total Assessment is a certain percentage of the fair market value that is determined by local assessors to be the total taxable value of land and additions on the property. | Land | Improvement |
|---|---|---|---|---|
| 2025 | $6,204 | $869,200 | $212,800 | $656,400 |
| 2024 | $6,204 | $869,200 | $212,800 | $656,400 |
| 2023 | $6,112 | $869,200 | $212,800 | $656,400 |
| 2022 | $5,620 | $640,000 | $103,500 | $536,500 |
| 2021 | $5,620 | $640,000 | $103,500 | $536,500 |
| 2020 | $5,620 | $640,000 | $103,500 | $536,500 |
| 2019 | $5,614 | $640,000 | $103,500 | $536,500 |
| 2018 | $5,549 | $505,100 | $49,700 | $455,400 |
| 2017 | $5,508 | $505,100 | $49,700 | $455,400 |
| 2016 | $5,504 | $505,100 | $49,700 | $455,400 |
| 2015 | $5,558 | $505,100 | $49,700 | $455,400 |
| 2014 | $5,756 | $531,900 | $76,500 | $455,400 |
Source: Public Records
Map
Nearby Homes
- 10110 Whispering Falls Ave
- 10131 Whispering Falls Ave
- 8407 Rolling Fields Rd
- 8102 Rolling Fields Rd
- 7909 Plantation Falls Ln
- 9113 Brief Rd
- 9420 Fairview Rd
- 9920 Stonebridge Way
- 12009 Wild Ginger Ln
- 9433 Stonebridge Way
- 10317 Clubhouse View Ln
- 00 Brief Rd
- 10526 Sycamore Club Dr
- 8591 Bartlett Rd
- 8857 Dartmoor Place
- 8917 Dartmoor Place
- 7918 Silver Maple Ln
- 7922 Silver Maple Ln
- 9525 Brief Rd
- 8809 Fairview Rd
- 8225 Rolling Fields Rd
- 8243 Rolling Fields Rd
- 8228 Rolling Fields Rd
- 8228 Rolling Fields Rd Unit 53
- 8215 Rolling Fields Rd
- 8301 Rolling Fields Rd
- 10005 Whispering Falls Ave
- 8205 Rolling Fields Rd
- 8311 Rolling Fields Rd
- 10015 Whispering Falls Ave
- 8316 Rolling Fields Rd
- 8145 Rolling Fields Rd
- 8321 Rolling Fields Rd
- 10025 Whispering Falls Ave
- 8326 Rolling Fields Rd
- 8140 Rolling Fields Rd
- 8140 Rolling Fields Rd Unit 51
- 8135 Rolling Fields Rd
- 8616 Brief Rd
- 8331 Rolling Fields Rd
Your Personal Tour Guide
Ask me questions while you tour the home.