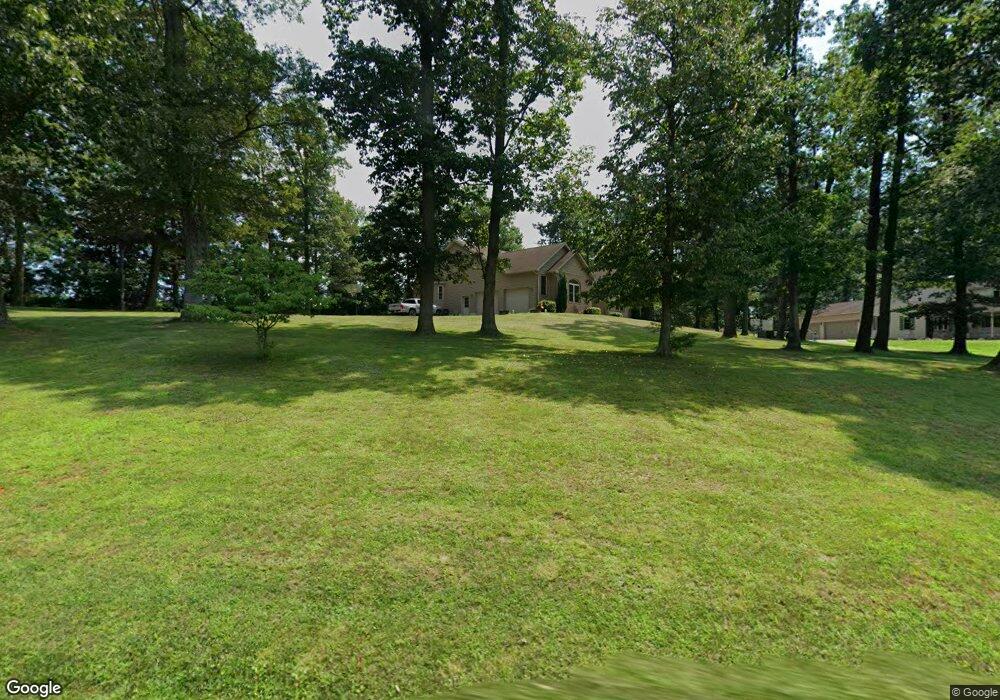
8236 Bobs Rd Felton, PA 17322
Estimated Value: $427,000 - $493,000
3
Beds
3
Baths
2,592
Sq Ft
$181/Sq Ft
Est. Value
About This Home
This home is located at 8236 Bobs Rd, Felton, PA 17322 and is currently estimated at $468,302, approximately $180 per square foot. 8236 Bobs Rd is a home located in York County with nearby schools including South Eastern Intermediate School, South Eastern Middle School, and Kennard-Dale High School.
Ownership History
Date
Name
Owned For
Owner Type
Purchase Details
Closed on
May 24, 2007
Sold by
Jim Price Builders Inc
Bought by
Walters R D and Walters Laura L
Current Estimated Value
Home Financials for this Owner
Home Financials are based on the most recent Mortgage that was taken out on this home.
Original Mortgage
$284,780
Outstanding Balance
$173,884
Interest Rate
6.24%
Mortgage Type
Purchase Money Mortgage
Estimated Equity
$294,418
Purchase Details
Closed on
Aug 15, 2006
Sold by
Baughman Thomas K and Baughman Lisa A
Bought by
Jim Price Builders Inc
Home Financials for this Owner
Home Financials are based on the most recent Mortgage that was taken out on this home.
Original Mortgage
$300,000
Interest Rate
6.8%
Mortgage Type
Purchase Money Mortgage
Create a Home Valuation Report for This Property
The Home Valuation Report is an in-depth analysis detailing your home's value as well as a comparison with similar homes in the area
Home Values in the Area
Average Home Value in this Area
Purchase History
| Date | Buyer | Sale Price | Title Company |
|---|---|---|---|
| Walters R D | $355,975 | None Available | |
| Jim Price Builders Inc | $80,000 | None Available |
Source: Public Records
Mortgage History
| Date | Status | Borrower | Loan Amount |
|---|---|---|---|
| Open | Walters R D | $284,780 | |
| Previous Owner | Jim Price Builders Inc | $300,000 |
Source: Public Records
Tax History Compared to Growth
Tax History
| Year | Tax Paid | Tax Assessment Tax Assessment Total Assessment is a certain percentage of the fair market value that is determined by local assessors to be the total taxable value of land and additions on the property. | Land | Improvement |
|---|---|---|---|---|
| 2025 | $8,142 | $270,050 | $56,490 | $213,560 |
| 2024 | $8,102 | $270,050 | $56,490 | $213,560 |
| 2023 | $8,102 | $270,050 | $56,490 | $213,560 |
| 2022 | $8,102 | $270,050 | $56,490 | $213,560 |
| 2021 | $7,802 | $270,050 | $56,490 | $213,560 |
| 2020 | $7,802 | $270,050 | $56,490 | $213,560 |
| 2019 | $7,775 | $270,050 | $56,490 | $213,560 |
| 2018 | $7,775 | $270,050 | $56,490 | $213,560 |
| 2017 | $7,759 | $270,050 | $56,490 | $213,560 |
| 2016 | $0 | $270,050 | $56,490 | $213,560 |
| 2015 | -- | $270,050 | $56,490 | $213,560 |
| 2014 | -- | $270,050 | $56,490 | $213,560 |
Source: Public Records
Map
Nearby Homes
- 15792 Cross Mill Rd
- 7923 Hickory Rd
- 8287 Pleasant Valley Rd
- 0 Lutz Rd Unit PAYK2095052
- 0 Lutz Rd Unit PAYK2095064
- 370 High Rock Rd
- 18183 Piedmont Rd
- 2733 Manor Furnace Rd
- 2727 Manor Furnace Rd
- 16434 Cross Roads Ave
- 18010 Dave Anne Cir
- 18007 Dave Anne Cir
- 257 Wiley Mill Rd
- 0 Seitz Rd
- 4389 Hess Rd
- 12706 High Point Rd
- 1059 Main Street Extension
- 18 Oriole Cir
- 11983 Tree Ln
- 180 Patterson Dr Unit 50
- 8216 Bobs Rd
- 8162 Bobs Rd
- 9602 Church Rd
- 9530 Church Rd
- 8042 Bobs Rd
- 9518 Church Rd
- 16582 Laurel Rd
- 9405 Church Rd
- 9248 Church Rd
- 8953 Hickory Rd
- 15623 Janes Way
- 9279 Church Rd
- 15655 Janes Way
- 15632 Janes Way
- 9206 Church Rd
- 9892 Hickory Rd
- 15697 Janes Way
- 16134 Laurel Rd
- 15694 Janes Way
- 16100 Laurel Rd