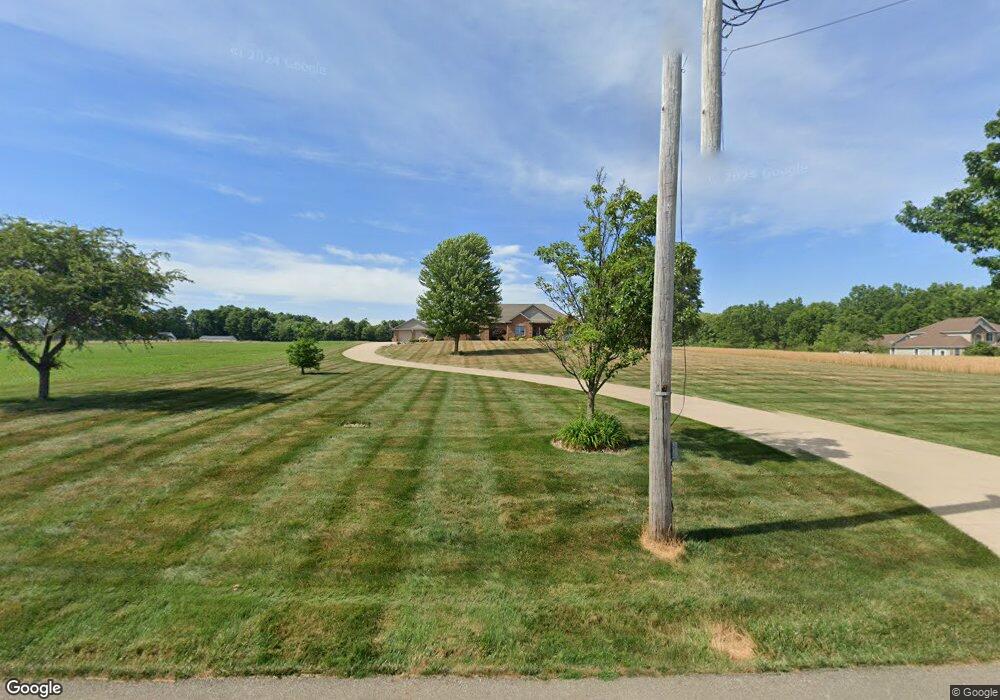
8237 Allen Dr NE Alliance, OH 44601
Estimated Value: $372,000 - $582,869
3
Beds
3
Baths
2,408
Sq Ft
$195/Sq Ft
Est. Value
About This Home
This home is located at 8237 Allen Dr NE, Alliance, OH 44601 and is currently estimated at $470,467, approximately $195 per square foot. 8237 Allen Dr NE is a home located in Stark County with nearby schools including Marlington High School.
Ownership History
Date
Name
Owned For
Owner Type
Purchase Details
Closed on
Feb 5, 2021
Sold by
Becker Patricia A and Becker Living Trust
Bought by
Becker Patricia Ann and Becker Gary David
Current Estimated Value
Home Financials for this Owner
Home Financials are based on the most recent Mortgage that was taken out on this home.
Original Mortgage
$91,100
Interest Rate
2.7%
Mortgage Type
New Conventional
Purchase Details
Closed on
Oct 20, 2010
Sold by
Becker Gary D and Becker Patricia A
Bought by
Becker Patricia A and Becker Living Trust
Home Financials for this Owner
Home Financials are based on the most recent Mortgage that was taken out on this home.
Original Mortgage
$227,900
Interest Rate
4.3%
Mortgage Type
New Conventional
Purchase Details
Closed on
Oct 6, 2010
Sold by
Becker Patricia A
Bought by
Becker Gary D and Becker Patricia A
Home Financials for this Owner
Home Financials are based on the most recent Mortgage that was taken out on this home.
Original Mortgage
$227,900
Interest Rate
4.3%
Mortgage Type
New Conventional
Create a Home Valuation Report for This Property
The Home Valuation Report is an in-depth analysis detailing your home's value as well as a comparison with similar homes in the area
Home Values in the Area
Average Home Value in this Area
Purchase History
| Date | Buyer | Sale Price | Title Company |
|---|---|---|---|
| Becker Patricia Ann | -- | None Available | |
| Becker Patricia A | -- | Attorney | |
| Becker Gary D | -- | Attorney |
Source: Public Records
Mortgage History
| Date | Status | Borrower | Loan Amount |
|---|---|---|---|
| Closed | Becker Patricia Ann | $91,100 | |
| Closed | Becker Patricia A | $227,900 |
Source: Public Records
Tax History Compared to Growth
Tax History
| Year | Tax Paid | Tax Assessment Tax Assessment Total Assessment is a certain percentage of the fair market value that is determined by local assessors to be the total taxable value of land and additions on the property. | Land | Improvement |
|---|---|---|---|---|
| 2025 | -- | $194,430 | $46,380 | $148,050 |
| 2024 | -- | $194,430 | $46,380 | $148,050 |
| 2023 | $5,551 | $150,260 | $32,170 | $118,090 |
| 2022 | $5,570 | $150,260 | $32,170 | $118,090 |
| 2021 | $5,590 | $150,260 | $32,170 | $118,090 |
| 2020 | $4,971 | $122,400 | $27,020 | $95,380 |
| 2019 | $4,936 | $122,410 | $27,030 | $95,380 |
| 2018 | $4,714 | $122,410 | $27,030 | $95,380 |
| 2017 | $5,012 | $120,460 | $21,960 | $98,500 |
| 2016 | $5,015 | $120,460 | $21,960 | $98,500 |
| 2015 | $5,023 | $120,460 | $21,960 | $98,500 |
| 2014 | $732 | $104,940 | $19,120 | $85,820 |
| 2013 | $2,315 | $104,940 | $19,120 | $85,820 |
Source: Public Records
Map
Nearby Homes
- 7377 Pontius St NE
- 167 State Route 44
- 8736 Lynn Park St NE
- 0 New Milford Rd Unit 5119787
- 3952 Laubert Rd
- 4829 Laubert Rd
- 14265 Reeder Ave NE
- 0 Pontius St NE
- 6180 Edison St NE
- 5615 Laubert Rd
- 1026 Hartville Rd N
- 1291 State Route 44
- 12561 Duquette Ave NE
- 5296 Eberly Rd
- 14920 Mccallum Ave NE
- 3990 Edison St NE
- 3705 Alexander Rd
- 3381 Alexander Rd
- 0 Waterloo Rd
- 5457 Waterloo Rd
- 8315 Allen Dr NE
- 8206 Allen Dr NE
- 8140 Allen Dr NE
- 8272 Allen Dr NE
- 8115 Allen Dr NE
- 8110 Allen Dr NE
- 8106 Allen Dr NE
- 8095 Allen Dr NE
- 8076 Allen Dr NE
- 8326 Allen Dr NE
- 8141 Allen Dr NE
- 8056 Allen Dr NE
- 8047 Allen Dr NE
- 8003 Allen Dr NE
- 8264 Allen Dr NE
- 14217 Osborne Ave NE
- 7979 Allen Dr NE
- 8410 Allen Dr NE
- 7960 Allen Dr NE
- 8108 Allen Dr NE