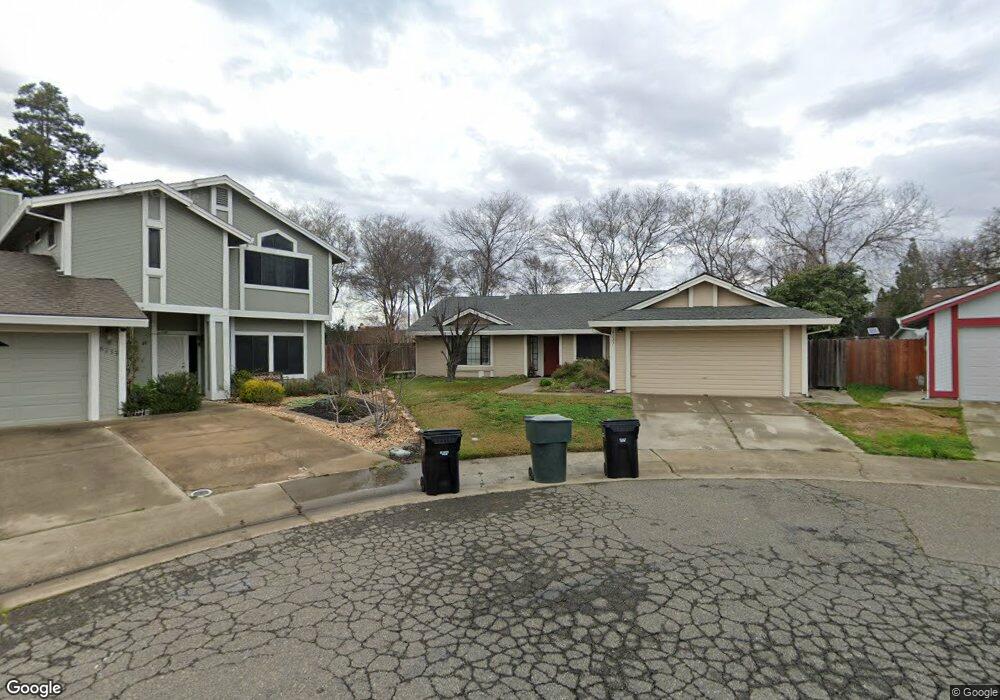
8237 Sanderson Ct Antelope, CA 95843
Estimated Value: $448,000 - $494,000
3
Beds
2
Baths
1,602
Sq Ft
$296/Sq Ft
Est. Value
About This Home
This home is located at 8237 Sanderson Ct, Antelope, CA 95843 and is currently estimated at $474,348, approximately $296 per square foot. 8237 Sanderson Ct is a home located in Sacramento County with nearby schools including Oak Hill Elementary School, Wilson C. Riles Middle School, and Center High School.
Ownership History
Date
Name
Owned For
Owner Type
Purchase Details
Closed on
May 16, 2009
Sold by
Perrault Scott
Bought by
Perrault Scott and Perrault Traci
Current Estimated Value
Home Financials for this Owner
Home Financials are based on the most recent Mortgage that was taken out on this home.
Original Mortgage
$138,551
Outstanding Balance
$87,304
Interest Rate
4.8%
Mortgage Type
New Conventional
Estimated Equity
$387,044
Purchase Details
Closed on
Feb 26, 2004
Sold by
Perrault Traci
Bought by
Perrault Scott A
Home Financials for this Owner
Home Financials are based on the most recent Mortgage that was taken out on this home.
Original Mortgage
$135,000
Interest Rate
5.62%
Mortgage Type
New Conventional
Purchase Details
Closed on
Oct 9, 1996
Sold by
Goff Phillip E and Goff Guyetta L
Bought by
Perrault Scott A and Perrault Traci
Home Financials for this Owner
Home Financials are based on the most recent Mortgage that was taken out on this home.
Original Mortgage
$120,000
Interest Rate
8.1%
Mortgage Type
VA
Create a Home Valuation Report for This Property
The Home Valuation Report is an in-depth analysis detailing your home's value as well as a comparison with similar homes in the area
Home Values in the Area
Average Home Value in this Area
Purchase History
| Date | Buyer | Sale Price | Title Company |
|---|---|---|---|
| Perrault Scott | -- | Lsi | |
| Perrault Scott A | -- | Alliance Title Company | |
| Perrault Scott A | $120,000 | Chicago Title Co |
Source: Public Records
Mortgage History
| Date | Status | Borrower | Loan Amount |
|---|---|---|---|
| Open | Perrault Scott | $138,551 | |
| Closed | Perrault Scott A | $135,000 | |
| Closed | Perrault Scott A | $120,000 |
Source: Public Records
Tax History
| Year | Tax Paid | Tax Assessment Tax Assessment Total Assessment is a certain percentage of the fair market value that is determined by local assessors to be the total taxable value of land and additions on the property. | Land | Improvement |
|---|---|---|---|---|
| 2025 | $2,366 | $195,414 | $65,132 | $130,282 |
| 2024 | $2,366 | $191,583 | $63,855 | $127,728 |
| 2023 | $2,316 | $187,827 | $62,603 | $125,224 |
| 2022 | $2,296 | $184,145 | $61,376 | $122,769 |
| 2021 | $2,355 | $180,535 | $60,173 | $120,362 |
| 2020 | $2,533 | $178,684 | $59,556 | $119,128 |
| 2019 | $2,313 | $175,182 | $58,389 | $116,793 |
| 2018 | $2,261 | $171,748 | $57,245 | $114,503 |
| 2017 | $2,194 | $168,381 | $56,123 | $112,258 |
| 2016 | $2,154 | $165,080 | $55,023 | $110,057 |
| 2015 | $2,002 | $162,601 | $54,197 | $108,404 |
| 2014 | $2,043 | $159,417 | $53,136 | $106,281 |
Source: Public Records
Map
Nearby Homes
- 3941 Grey Livery Way
- 8425 Morning Skye Way
- 3707 Pinehill Way
- 4009 Honey Rose Place
- 8256 Benjamin Dr
- 4115 Copper Hill Ct
- 3724 Black Eagle Dr
- 8432 Giverny Cir
- 4142 Lake Placid Ct
- 8111 Aztec Way
- 8541 Brisenbourg Way
- 8121 Deer Spring Cir
- 4246 Albertville Way
- 4133 Singing Tree Way
- 8233 Dalkeith Way
- 3549 Misty Lake Dr
- 3541 Misty Lake Dr
- 3537 Misty Lake Dr
- 3556 Misty Lake Dr
- 8434 Walerga Rd Unit 327
- 8233 Sanderson Ct
- 8236 Sanderson Ct
- 8229 Sanderson Ct
- 8232 Sanderson Ct
- 8316 Brixham Ct
- 8312 Brixham Ct
- 8228 Sanderson Ct
- 8225 Sanderson Ct
- 8308 Brixham Ct
- 8304 Brixham Ct
- 8224 Sanderson Ct
- 8221 Sanderson Ct
- 3941 Weybridge Way
- 8220 Sanderson Ct
- 3937 Weybridge Way
- 8300 Brixham Ct
- 8309 Bramble Bush Cir
- 8313 Bramble Bush Cir
- 3953 Weybridge Way
- 8305 Bramble Bush Cir
Your Personal Tour Guide
Ask me questions while you tour the home.