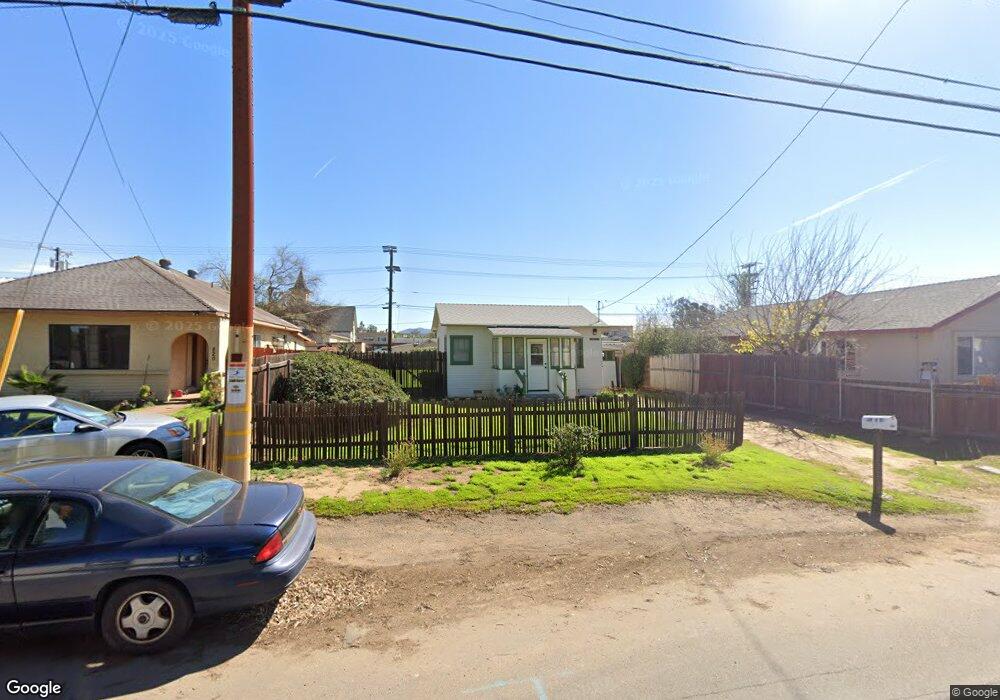
824 B St Ramona, CA 92065
Estimated Value: $356,531 - $508,000
1
Bed
1
Bath
450
Sq Ft
$959/Sq Ft
Est. Value
About This Home
This home is located at 824 B St, Ramona, CA 92065 and is currently estimated at $431,633, approximately $959 per square foot. 824 B St is a home located in San Diego County with nearby schools including Ramona Elementary School, Olive Peirce Middle School, and Ramona High School.
Ownership History
Date
Name
Owned For
Owner Type
Purchase Details
Closed on
Mar 2, 1999
Sold by
Totoman Adele and Cavallari Victoria
Bought by
Drilling Margy C
Current Estimated Value
Purchase Details
Closed on
Jan 29, 1999
Sold by
Stumpf Family Trust 04-15-96
Bought by
Cavallari Victoria and Totman Adele
Purchase Details
Closed on
Apr 15, 1996
Sold by
Stumpf Freda E
Bought by
Stumpf Freda E
Create a Home Valuation Report for This Property
The Home Valuation Report is an in-depth analysis detailing your home's value as well as a comparison with similar homes in the area
Home Values in the Area
Average Home Value in this Area
Purchase History
| Date | Buyer | Sale Price | Title Company |
|---|---|---|---|
| Drilling Margy C | $70,000 | First American Title Ins Co | |
| Cavallari Victoria | -- | First American Title Ins Co | |
| Totman Adele | -- | First American Title Ins Co | |
| Cavallari Victoria | -- | -- | |
| Stumpf Freda E | -- | -- |
Source: Public Records
Tax History
| Year | Tax Paid | Tax Assessment Tax Assessment Total Assessment is a certain percentage of the fair market value that is determined by local assessors to be the total taxable value of land and additions on the property. | Land | Improvement |
|---|---|---|---|---|
| 2025 | $2,181 | $109,557 | $94,049 | $15,508 |
| 2024 | $2,181 | $107,409 | $92,205 | $15,204 |
| 2023 | $1,967 | $105,304 | $90,398 | $14,906 |
| 2022 | $2,138 | $103,240 | $88,626 | $14,614 |
| 2021 | $2,123 | $101,217 | $86,889 | $14,328 |
| 2020 | $2,115 | $100,181 | $85,999 | $14,182 |
| 2019 | $2,075 | $98,217 | $84,313 | $13,904 |
| 2018 | $2,030 | $96,292 | $82,660 | $13,632 |
| 2017 | $2,009 | $94,405 | $81,040 | $13,365 |
| 2016 | $1,957 | $92,554 | $79,451 | $13,103 |
| 2015 | $1,892 | $91,165 | $78,258 | $12,907 |
| 2014 | $1,830 | $89,381 | $76,726 | $12,655 |
Source: Public Records
Map
Nearby Homes
Your Personal Tour Guide
Ask me questions while you tour the home.