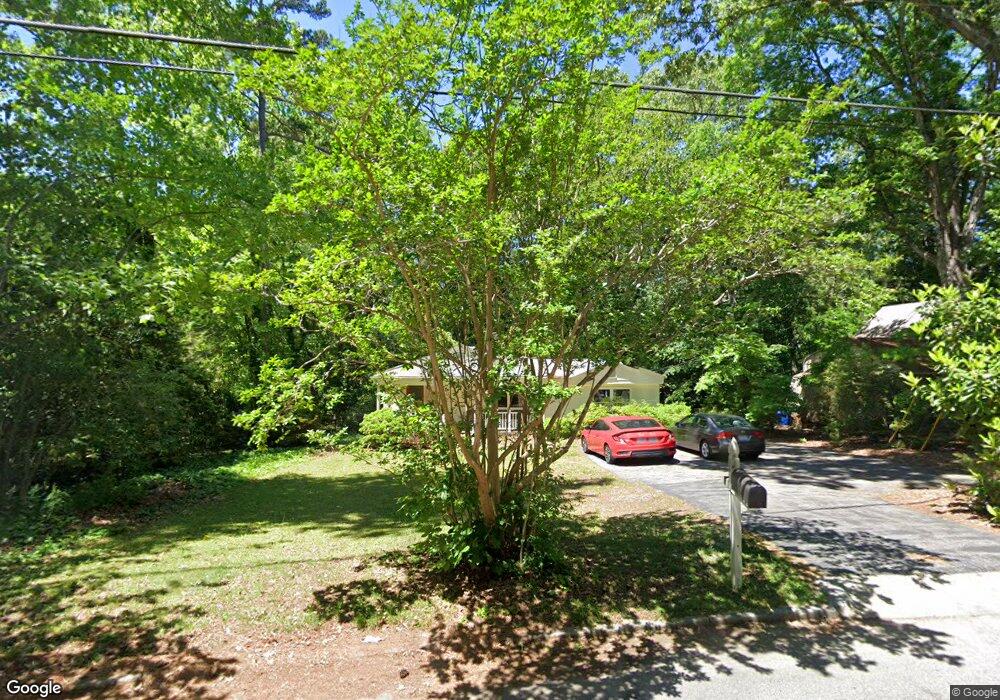
824 Merrie Rd Raleigh, NC 27606
Avent West NeighborhoodEstimated Value: $438,817 - $474,000
4
Beds
2
Baths
1,556
Sq Ft
$289/Sq Ft
Est. Value
About This Home
This home is located at 824 Merrie Rd, Raleigh, NC 27606 and is currently estimated at $449,954, approximately $289 per square foot. 824 Merrie Rd is a home located in Wake County with nearby schools including A. B. Combs Magnet Elementary School, Centennial Campus Magnet Middle School, and Atlas International School.
Ownership History
Date
Name
Owned For
Owner Type
Purchase Details
Closed on
Sep 30, 2014
Sold by
Lingafelt Charles Steven and Lingafelt Patti B
Bought by
Roper Lingafelt Holdings Llc
Current Estimated Value
Purchase Details
Closed on
Apr 29, 2006
Sold by
Bunch David E and Bunch Treasea B
Bought by
Lingafelt Charles Steven
Home Financials for this Owner
Home Financials are based on the most recent Mortgage that was taken out on this home.
Original Mortgage
$131,200
Outstanding Balance
$75,681
Interest Rate
6.33%
Mortgage Type
Purchase Money Mortgage
Estimated Equity
$374,273
Purchase Details
Closed on
Jul 28, 2004
Sold by
Andersen Marc and Andersen Birgit
Bought by
Bunch David E and Bunch Treasea B
Home Financials for this Owner
Home Financials are based on the most recent Mortgage that was taken out on this home.
Original Mortgage
$121,600
Interest Rate
3.37%
Mortgage Type
New Conventional
Purchase Details
Closed on
Sep 11, 2000
Sold by
Hughes Christopher T
Bought by
Anderson Marc and Anderson Birgit
Home Financials for this Owner
Home Financials are based on the most recent Mortgage that was taken out on this home.
Original Mortgage
$113,600
Interest Rate
8.17%
Create a Home Valuation Report for This Property
The Home Valuation Report is an in-depth analysis detailing your home's value as well as a comparison with similar homes in the area
Home Values in the Area
Average Home Value in this Area
Purchase History
| Date | Buyer | Sale Price | Title Company |
|---|---|---|---|
| Roper Lingafelt Holdings Llc | -- | None Available | |
| Lingafelt Charles Steven | $164,000 | None Available | |
| Bunch David E | $152,000 | -- | |
| Anderson Marc | $142,000 | -- |
Source: Public Records
Mortgage History
| Date | Status | Borrower | Loan Amount |
|---|---|---|---|
| Open | Lingafelt Charles Steven | $131,200 | |
| Previous Owner | Bunch David E | $121,600 | |
| Previous Owner | Anderson Marc | $113,600 |
Source: Public Records
Tax History Compared to Growth
Tax History
| Year | Tax Paid | Tax Assessment Tax Assessment Total Assessment is a certain percentage of the fair market value that is determined by local assessors to be the total taxable value of land and additions on the property. | Land | Improvement |
|---|---|---|---|---|
| 2025 | -- | $392,726 | $236,250 | $156,476 |
| 2024 | $3,431 | $392,726 | $236,250 | $156,476 |
| 2023 | $2,542 | $231,343 | $110,000 | $121,343 |
| 2022 | $2,362 | $231,343 | $110,000 | $121,343 |
| 2021 | $2,271 | $231,343 | $110,000 | $121,343 |
| 2020 | $2,230 | $231,343 | $110,000 | $121,343 |
| 2019 | $2,059 | $175,975 | $80,000 | $95,975 |
| 2018 | $1,943 | $175,975 | $80,000 | $95,975 |
| 2017 | $1,851 | $175,975 | $80,000 | $95,975 |
| 2016 | $0 | $175,975 | $80,000 | $95,975 |
| 2015 | -- | $172,228 | $85,000 | $87,228 |
| 2014 | $1,711 | $172,228 | $85,000 | $87,228 |
Source: Public Records
Map
Nearby Homes
- 820 Nuttree Place
- 713 Valerie Dr
- 3418 Avent Ferry Rd
- 913 Merwin Rd
- 1956 Gorman St
- 3710 Lail Ct
- 1221 University Ct Unit 304
- 1241 University Ct Unit 204
- 1411 Collegiate Cir Unit 302
- 1704 Athens Dr
- 1033 Oak Lake Ct
- 1230 University Ct Unit 203
- 4609 Kaplan Dr
- 1321 Crab Orchard Dr Unit 203
- 4350 Hunters Club Dr
- 4242 Kaplan Dr
- 4258 Kaplan Dr
- 5101 Wickham Rd
- 1312 Onslow Rd
- 4237 The Oaks Dr Unit J3
- 820 Merrie Rd
- 828 Merrie Rd
- 805 Nuttree Place
- 816 Merrie Rd
- 809 Nuttree Place
- 801 Nuttree Place
- 813 Nuttree Place
- 3410 Octavia St
- 3400 Octavia St
- 827 Merrie Rd
- 812 Merrie Rd
- 823 Merrie Rd
- 817 Nuttree Place
- 816 Barbara Dr
- 819 Merrie Rd
- 3324 Octavia St
- 813 Barbara Dr
- 800 Nuttree Place
- 808 Merrie Rd
- 815 Merrie Rd