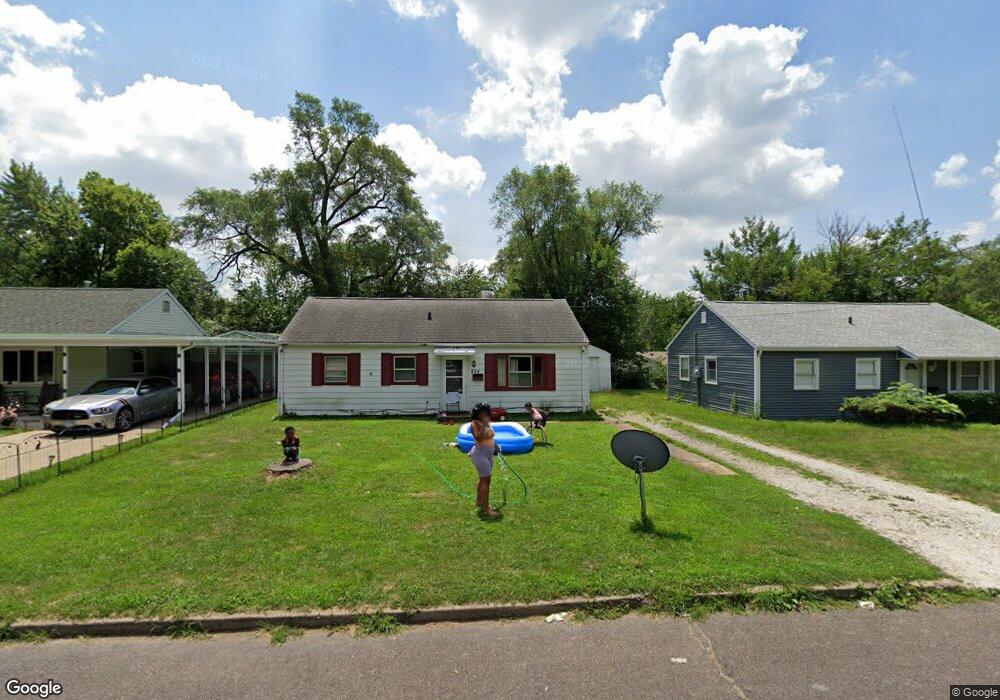
824 W Brons Ave Peoria, IL 61604
West Bluff NeighborhoodEstimated Value: $56,000 - $71,000
3
Beds
1
Bath
864
Sq Ft
$70/Sq Ft
Est. Value
About This Home
This home is located at 824 W Brons Ave, Peoria, IL 61604 and is currently estimated at $60,788, approximately $70 per square foot. 824 W Brons Ave is a home located in Peoria County with nearby schools including Dr. C. T. Vivian Primary School, Sterling Middle School, and Peoria High School.
Ownership History
Date
Name
Owned For
Owner Type
Purchase Details
Closed on
May 2, 2025
Sold by
Cohen Jeff A and Cohen Jeffrey
Bought by
Princess Tiger Lily Llc
Current Estimated Value
Home Financials for this Owner
Home Financials are based on the most recent Mortgage that was taken out on this home.
Original Mortgage
$1,031,640
Outstanding Balance
$971,787
Interest Rate
5.82%
Mortgage Type
New Conventional
Estimated Equity
-$910,999
Purchase Details
Closed on
Jan 21, 2021
Sold by
Sheriff Of Peoria County
Bought by
Cohen Jeff and Federal Home Loan Bank Of Des
Purchase Details
Closed on
Jul 23, 2018
Sold by
Dennis Wells and Dennis Debra
Bought by
Binion Rosa M and Binion Rosie L
Home Financials for this Owner
Home Financials are based on the most recent Mortgage that was taken out on this home.
Original Mortgage
$37,311
Interest Rate
4.6%
Mortgage Type
FHA
Purchase Details
Closed on
Jan 3, 2005
Bought by
Wells Debra L and Wells Dennis J
Create a Home Valuation Report for This Property
The Home Valuation Report is an in-depth analysis detailing your home's value as well as a comparison with similar homes in the area
Home Values in the Area
Average Home Value in this Area
Purchase History
| Date | Buyer | Sale Price | Title Company |
|---|---|---|---|
| Princess Tiger Lily Llc | $1,017,530 | None Listed On Document | |
| Cohen Jeff | -- | None Listed On Document | |
| Binion Rosa M | $38,000 | Attorney Only | |
| Binion Rosa M | $38,000 | Cusack Gilfillan Oday Llc | |
| Wells Debra L | $31,500 | -- |
Source: Public Records
Mortgage History
| Date | Status | Borrower | Loan Amount |
|---|---|---|---|
| Open | Princess Tiger Lily Llc | $1,031,640 | |
| Previous Owner | Binion Rosa M | $37,311 |
Source: Public Records
Tax History Compared to Growth
Tax History
| Year | Tax Paid | Tax Assessment Tax Assessment Total Assessment is a certain percentage of the fair market value that is determined by local assessors to be the total taxable value of land and additions on the property. | Land | Improvement |
|---|---|---|---|---|
| 2024 | $1,252 | $13,840 | $2,320 | $11,520 |
| 2023 | $1,195 | $12,700 | $2,130 | $10,570 |
| 2022 | $1,144 | $11,860 | $2,010 | $9,850 |
| 2021 | $1,122 | $11,290 | $1,910 | $9,380 |
| 2020 | $658 | $11,180 | $1,890 | $9,290 |
| 2019 | $655 | $11,410 | $1,930 | $9,480 |
| 2018 | $1,129 | $11,590 | $1,950 | $9,640 |
| 2017 | $1,129 | $11,710 | $1,970 | $9,740 |
| 2016 | $1,097 | $11,710 | $1,970 | $9,740 |
| 2015 | $1,188 | $11,480 | $1,930 | $9,550 |
| 2014 | $1,188 | $12,910 | $1,950 | $10,960 |
| 2013 | -- | $13,060 | $1,970 | $11,090 |
Source: Public Records
Map
Nearby Homes
- 2119 N Broadway St
- 803 W Meadows Place
- 1001 W Brons Ave
- 809 W Eleanor Place
- 823 W Nowland Ave
- 1017 W Brons Ave
- 812 W Macqueen Ave
- 1917 N Broadway St
- 2315 N Ellis St
- 1104 W Rice St
- 2215 N Flora Ave
- 807 W Mcclure Ave
- 909 W Mcclure Ave
- 2309 N Flora Ave
- 2302 N Flora Ave
- 1210 W Macqueen Ave
- 2205 N North St
- 1207 W Mcclure Ave
- 1626 N Douglas St
- 810 W Hanssler Place
- 828 W Brons Ave
- 820 W Brons Ave
- 823 W Bartlett Ct
- 819 W Bartlett Ct
- 827 W Bartlett Ct
- 816 W Brons Ave
- 832 W Brons Ave
- 2124 N Broadway St
- 815 W Bartlett Ct
- 812 W Brons Ave
- 821 W Brons Ave
- 825 W Brons Ave
- 811 W Bartlett Ct
- 819 W Brons Ave
- 815 W Brons Ave
- 824 W Bartlett Ct
- 901 W Brons Ave
- 820 W Bartlett Ct
- 818 W Bartlett Ct
- 811 W Brons Ave