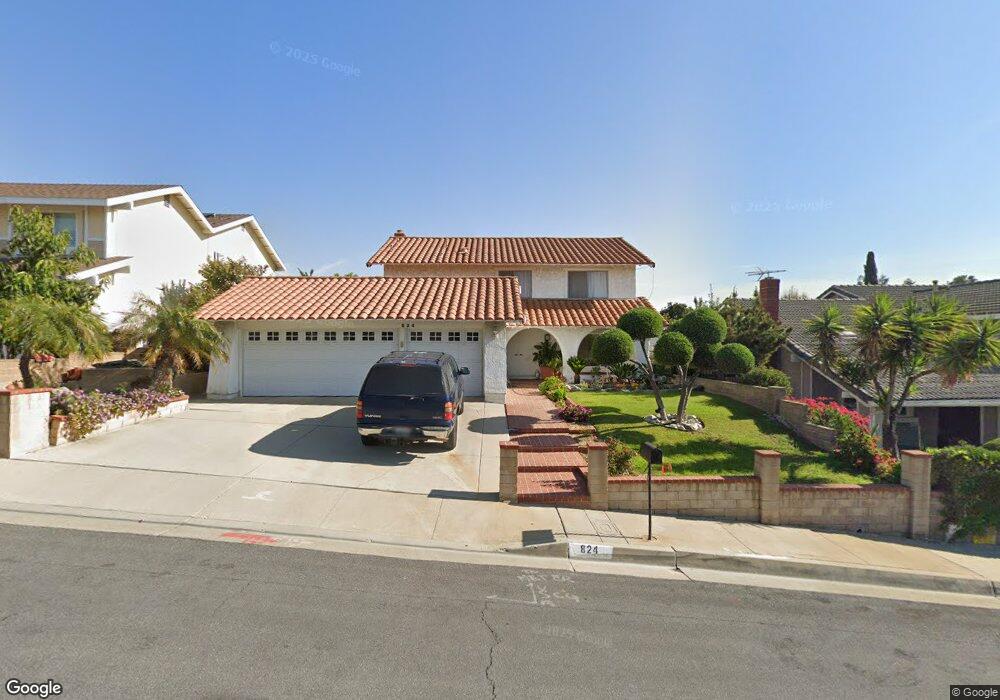
824 W Bunker Hill Ave Montebello, CA 90640
Estimated Value: $1,001,000 - $1,078,000
3
Beds
3
Baths
1,854
Sq Ft
$554/Sq Ft
Est. Value
About This Home
This home is located at 824 W Bunker Hill Ave, Montebello, CA 90640 and is currently estimated at $1,026,507, approximately $553 per square foot. 824 W Bunker Hill Ave is a home located in Los Angeles County with nearby schools including La Merced Elementary School, La Merced Intermediate School, and Montebello High School.
Ownership History
Date
Name
Owned For
Owner Type
Purchase Details
Closed on
Mar 14, 2016
Sold by
Gonzalez Francisco
Bought by
Gonzalez Francisco and Gonzalez Maria Teresa
Current Estimated Value
Home Financials for this Owner
Home Financials are based on the most recent Mortgage that was taken out on this home.
Original Mortgage
$400,000
Outstanding Balance
$316,493
Interest Rate
3.64%
Mortgage Type
New Conventional
Estimated Equity
$710,014
Purchase Details
Closed on
Jun 3, 1997
Sold by
The Chase Manhattan Bank Na
Bought by
Gonzalez Francisco
Home Financials for this Owner
Home Financials are based on the most recent Mortgage that was taken out on this home.
Original Mortgage
$189,000
Interest Rate
7.87%
Purchase Details
Closed on
Jul 25, 1996
Sold by
Dudaklian Vrezh and Dudaklian Baydzar
Bought by
The Chase Manhattan Bank Na
Create a Home Valuation Report for This Property
The Home Valuation Report is an in-depth analysis detailing your home's value as well as a comparison with similar homes in the area
Home Values in the Area
Average Home Value in this Area
Purchase History
| Date | Buyer | Sale Price | Title Company |
|---|---|---|---|
| Gonzalez Francisco | -- | Wfg Title Company | |
| Gonzalez Francisco | $210,500 | Landsafe Title | |
| The Chase Manhattan Bank Na | $239,000 | Landsafe Title |
Source: Public Records
Mortgage History
| Date | Status | Borrower | Loan Amount |
|---|---|---|---|
| Open | Gonzalez Francisco | $400,000 | |
| Closed | Gonzalez Francisco | $189,000 |
Source: Public Records
Tax History Compared to Growth
Tax History
| Year | Tax Paid | Tax Assessment Tax Assessment Total Assessment is a certain percentage of the fair market value that is determined by local assessors to be the total taxable value of land and additions on the property. | Land | Improvement |
|---|---|---|---|---|
| 2025 | $5,261 | $336,088 | $162,694 | $173,394 |
| 2024 | $5,261 | $329,499 | $159,504 | $169,995 |
| 2023 | $5,239 | $323,039 | $156,377 | $166,662 |
| 2022 | $5,065 | $316,706 | $153,311 | $163,395 |
| 2021 | $4,880 | $310,497 | $150,305 | $160,192 |
| 2019 | $4,661 | $301,290 | $145,848 | $155,442 |
| 2018 | $4,645 | $295,384 | $142,989 | $152,395 |
| 2016 | $4,440 | $283,916 | $137,438 | $146,478 |
| 2015 | $4,212 | $279,652 | $135,374 | $144,278 |
| 2014 | $4,159 | $274,175 | $132,723 | $141,452 |
Source: Public Records
Map
Nearby Homes
- 1018 W Yorktown Ave
- 228 Mullberry Place
- 929 W Ashiya Rd
- 378 Mullberry Place
- 211 Peacock Ln
- 48 Primrose Ct
- 1155 Poppy Ct
- 1108 Poppy Ct
- 737 N 4th St
- 1198 Poppy Ct
- 1012 Burke Dr
- 105 Remy Ln
- 25 Remy Ln
- 15 Remy Ln
- 55 Remy Ln
- Apex Plan at Metro Heights - Viewpoint
- Spectrum Plan at Metro Heights - Viewpoint
- 1413 Cuesta Way
- 1004 N Las Flores Ave
- 861 Marconi St
- 820 W Bunker Hill Ave
- 828 W Bunker Hill Ave
- 817 W Suffolk Ave
- 816 W Bunker Hill Ave
- 832 W Bunker Hill Ave
- 813 W Suffolk Ave
- 821 W Suffolk Ave
- 809 W Suffolk Ave
- 823 W Bunker Hill Ave
- 819 W Bunker Hill Ave
- 827 W Bunker Hill Ave
- 812 W Bunker Hill Ave
- 825 W Suffolk Ave
- 900 W Bunker Hill Ave
- 805 W Suffolk Ave
- 815 W Bunker Hill Ave
- 831 W Bunker Hill Ave
- 829 W Suffolk Ave
- 808 W Bunker Hill Ave
- 904 W Bunker Hill Ave