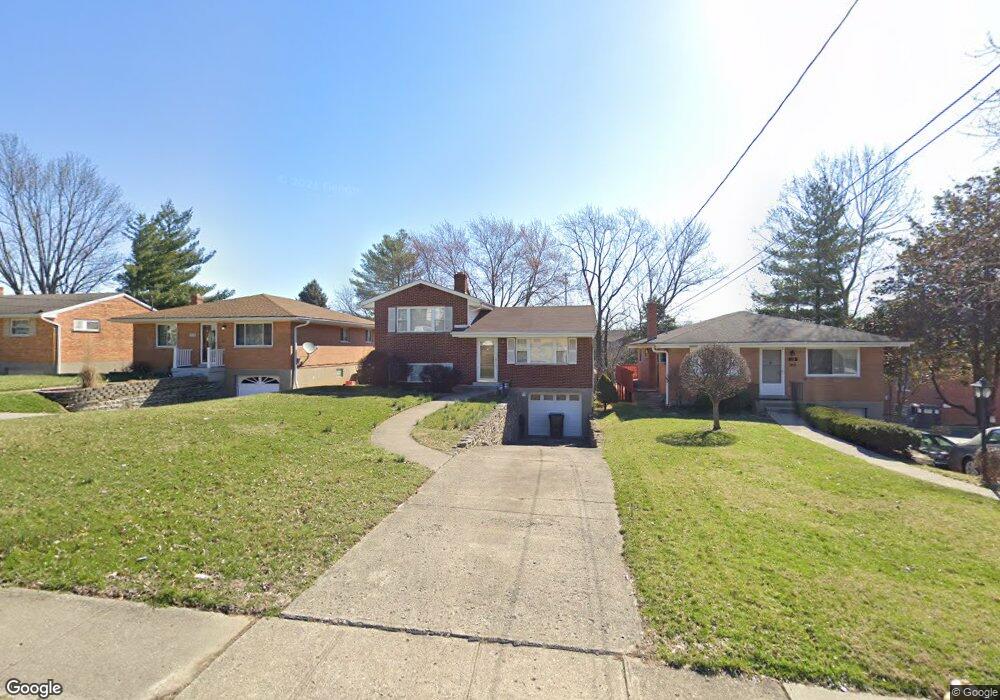
8240 Bobolink Ave Cincinnati, OH 45231
Estimated Value: $196,631 - $239,000
3
Beds
2
Baths
1,250
Sq Ft
$174/Sq Ft
Est. Value
About This Home
This home is located at 8240 Bobolink Ave, Cincinnati, OH 45231 and is currently estimated at $217,658, approximately $174 per square foot. 8240 Bobolink Ave is a home located in Hamilton County with nearby schools including North College Hill Elementary School, North College Hill Middle School, and North College Hill High School.
Ownership History
Date
Name
Owned For
Owner Type
Purchase Details
Closed on
Jan 11, 2011
Sold by
Frye Nejela and Frye Michael
Bought by
Evans Jamiela M
Current Estimated Value
Home Financials for this Owner
Home Financials are based on the most recent Mortgage that was taken out on this home.
Original Mortgage
$87,620
Outstanding Balance
$55,200
Interest Rate
3.25%
Mortgage Type
FHA
Estimated Equity
$162,458
Purchase Details
Closed on
Jul 19, 2010
Sold by
Secretary Of Housing & Urban Development
Bought by
Frye Nejela
Home Financials for this Owner
Home Financials are based on the most recent Mortgage that was taken out on this home.
Original Mortgage
$34,935
Interest Rate
4.63%
Mortgage Type
Future Advance Clause Open End Mortgage
Purchase Details
Closed on
Sep 28, 2009
Sold by
Conners Lori A
Bought by
U S Bank Na
Purchase Details
Closed on
Jul 29, 2009
Sold by
Us Bank Na
Bought by
Secretary Of Housing & Urban Development
Create a Home Valuation Report for This Property
The Home Valuation Report is an in-depth analysis detailing your home's value as well as a comparison with similar homes in the area
Home Values in the Area
Average Home Value in this Area
Purchase History
| Date | Buyer | Sale Price | Title Company |
|---|---|---|---|
| Evans Jamiela M | $89,900 | Attorney | |
| Frye Nejela | $41,100 | Attorney | |
| U S Bank Na | $54,000 | None Available | |
| Secretary Of Housing & Urban Development | -- | None Available |
Source: Public Records
Mortgage History
| Date | Status | Borrower | Loan Amount |
|---|---|---|---|
| Open | Evans Jamiela M | $87,620 | |
| Previous Owner | Frye Nejela | $34,935 |
Source: Public Records
Tax History Compared to Growth
Tax History
| Year | Tax Paid | Tax Assessment Tax Assessment Total Assessment is a certain percentage of the fair market value that is determined by local assessors to be the total taxable value of land and additions on the property. | Land | Improvement |
|---|---|---|---|---|
| 2024 | $2,440 | $48,231 | $7,102 | $41,129 |
| 2023 | $2,462 | $48,231 | $7,102 | $41,129 |
| 2022 | $2,222 | $31,063 | $5,366 | $25,697 |
| 2021 | $2,174 | $31,063 | $5,366 | $25,697 |
| 2020 | $1,908 | $31,063 | $5,366 | $25,697 |
| 2019 | $1,871 | $27,248 | $4,708 | $22,540 |
| 2018 | $1,872 | $27,248 | $4,708 | $22,540 |
| 2017 | $1,771 | $27,248 | $4,708 | $22,540 |
| 2016 | $1,808 | $29,579 | $6,384 | $23,195 |
| 2015 | $1,812 | $29,579 | $6,384 | $23,195 |
| 2014 | $1,810 | $29,579 | $6,384 | $23,195 |
| 2013 | $1,868 | $31,465 | $6,790 | $24,675 |
Source: Public Records
Map
Nearby Homes
- 7923 Bobolink Dr
- 1280 Brushwood Ave
- 7929 Cherrywood Ct
- 8579 Daly Rd
- 8543 Foxcroft Dr
- 6765 Richard Ave
- 6832 Tarawa Dr
- 8681 Desoto Dr
- 6596 S Oak Knoll Dr
- 6586 S Oak Knoll Dr
- 6785 Marvin Ave
- 6642 Plantation Way
- 1544 W Galbraith Rd
- 1025 Eastgate Dr
- 1478 Foxwood Dr
- 6538 S Oak Knoll Dr
- 1006 Hearthstone Dr
- 8772 Balboa Dr
- 1029 Bluejay Dr
- 8584 Mockingbird Ln
- 8234 Bobolink Ave
- 8248 Bobolink Ave
- 8254 Bobolink Ave
- 1232 W Galbraith Rd
- 0 Bobolink Dr
- 8268 Bobolink Dr
- 8268 Bobolink Ave
- 8274 Bobolink Ave
- 8247 Bobolink Dr
- 8247 Bobolink Ave
- 1260 W Galbraith Rd
- 8249 Bobolink Ave
- 8269 Bobolink Ave
- 1264 W Galbraith Rd
- 8282 Bobolink Ave
- 8271 Bobolink Ave
- 8273 Bobolink Ave
- 8288 Bobolink Dr
- 8288 Bobolink Ave
- 8283 Bobolink Ave