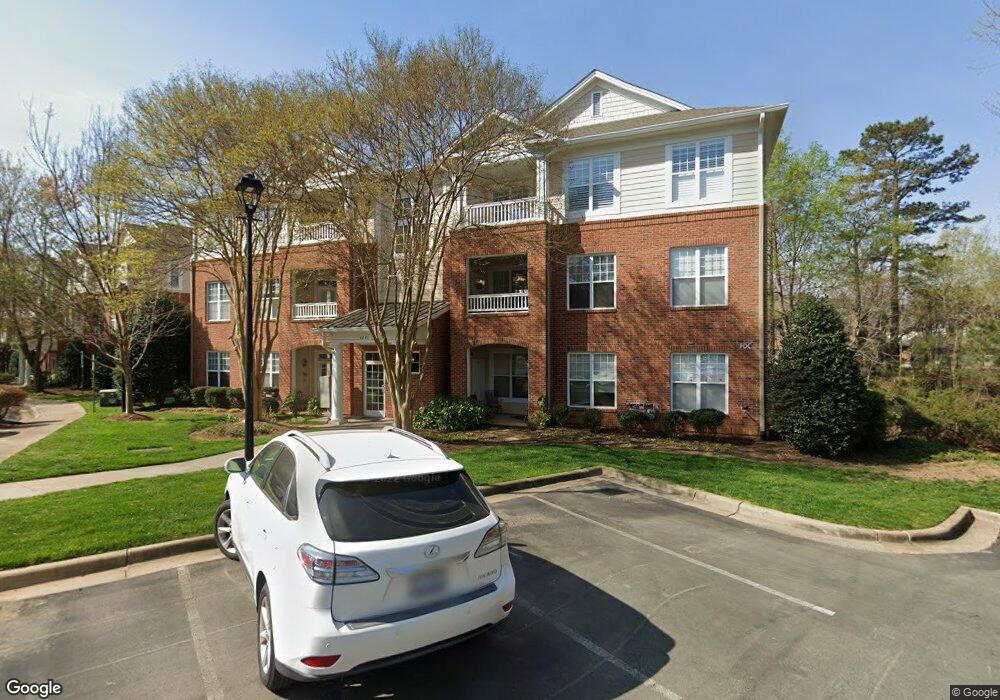
8241 Allyns Landing Way Unit 303 Raleigh, NC 27615
Six Forks NeighborhoodEstimated Value: $255,000 - $290,000
2
Beds
2
Baths
1,094
Sq Ft
$250/Sq Ft
Est. Value
About This Home
This home is located at 8241 Allyns Landing Way Unit 303, Raleigh, NC 27615 and is currently estimated at $273,509, approximately $250 per square foot. 8241 Allyns Landing Way Unit 303 is a home located in Wake County with nearby schools including Lead Mine Elementary School, West Millbrook Middle School, and Sanderson High School.
Ownership History
Date
Name
Owned For
Owner Type
Purchase Details
Closed on
Jan 27, 2022
Sold by
Simpkins and Bettie
Bought by
Hagen Suzaane T
Current Estimated Value
Purchase Details
Closed on
Aug 9, 2016
Sold by
Ceroft Sue N
Bought by
Simpkins Rodney
Purchase Details
Closed on
Jun 29, 2007
Sold by
Eubanks Delinda K and Blankenhorn Darrell E
Bought by
Croft Sue N
Home Financials for this Owner
Home Financials are based on the most recent Mortgage that was taken out on this home.
Original Mortgage
$121,600
Interest Rate
6.16%
Mortgage Type
Purchase Money Mortgage
Purchase Details
Closed on
Oct 31, 2002
Sold by
First Raleigh Development Llc
Bought by
Eubanks Delinda K
Home Financials for this Owner
Home Financials are based on the most recent Mortgage that was taken out on this home.
Original Mortgage
$138,197
Interest Rate
6.01%
Create a Home Valuation Report for This Property
The Home Valuation Report is an in-depth analysis detailing your home's value as well as a comparison with similar homes in the area
Home Values in the Area
Average Home Value in this Area
Purchase History
| Date | Buyer | Sale Price | Title Company |
|---|---|---|---|
| Hagen Suzaane T | $230,000 | Investors Title | |
| Hagen Suzaane T | $230,000 | Investors Title | |
| Simpkins Rodney | $146,500 | None Available | |
| Croft Sue N | $152,000 | None Available | |
| Eubanks Delinda K | $140,000 | -- |
Source: Public Records
Mortgage History
| Date | Status | Borrower | Loan Amount |
|---|---|---|---|
| Previous Owner | Croft Sue N | $121,600 | |
| Previous Owner | Eubanks Delinda K | $138,197 |
Source: Public Records
Tax History Compared to Growth
Tax History
| Year | Tax Paid | Tax Assessment Tax Assessment Total Assessment is a certain percentage of the fair market value that is determined by local assessors to be the total taxable value of land and additions on the property. | Land | Improvement |
|---|---|---|---|---|
| 2025 | $2,434 | $276,799 | -- | $276,799 |
| 2024 | $2,424 | $276,799 | $0 | $276,799 |
| 2023 | $2,311 | $183,145 | $0 | $183,145 |
| 2022 | $2,148 | $183,145 | $0 | $183,145 |
| 2021 | $1,802 | $183,145 | $0 | $183,145 |
| 2020 | $1,760 | $183,145 | $0 | $183,145 |
| 2019 | $1,712 | $146,808 | $0 | $146,808 |
| 2018 | $1,615 | $146,808 | $0 | $146,808 |
| 2017 | $1,539 | $146,808 | $0 | $146,808 |
| 2016 | -- | $146,808 | $0 | $146,808 |
| 2015 | $1,688 | $161,065 | $0 | $161,065 |
| 2014 | $1,601 | $161,065 | $0 | $161,065 |
Source: Public Records
Map
Nearby Homes
- 206 Nouveau Ave
- 8011 Allyns Landing Way Unit 202
- 8011 Allyns Landing Way Unit 302
- 8124 Upper Lake Dr
- 8004 Thrush Ridge Ln
- 8021 Thrush Ridge Ln
- 8305 Society Place
- 42 Renwick Ct
- 8039 Brandyapple Dr
- 8015 Brown Bark Place
- 8325 Stryker Ct
- 136 Yorkchester Way
- 7913 Wood Cove Ct
- 119 Yorkchester Way
- 8121 Greys Landing Way
- 9324&9330 Six Forks Rd
- 7731 Kingsberry Ct
- 7715 Kingsberry Ct
- 721 Tan Tara Square
- 8308 Grey Abbey Place
- 8241 Allyns Landing Way Unit 304
- 8241 Allyns Landing Way Unit 302
- 8241 Allyns Landing Way Unit 203
- 8241 Allyns Landing Way Unit 202
- 8241 Allyns Landing Way Unit 201
- 8241 Allyns Landing Way Unit 104
- 8241 Allyns Landing Way Unit 103
- 8241 Allyns Landing Way Unit 102
- 8241 Allyns Landing Way Unit 101
- 8241 Allyns Landing Way Unit 3
- 8241 Allyns Landing Way Unit 2
- 8241 Allyns Landing Way
- 8231 Allyns Landing Way Unit 304
- 8231 Allyns Landing Way Unit 303
- 8231 Allyns Landing Way Unit 301
- 8231 Allyns Landing Way Unit 204
- 8231 Allyns Landing Way Unit 203
- 8231 Allyns Landing Way Unit 202
- 8231 Allyns Landing Way Unit 201
- 8231 Allyns Landing Way Unit 103