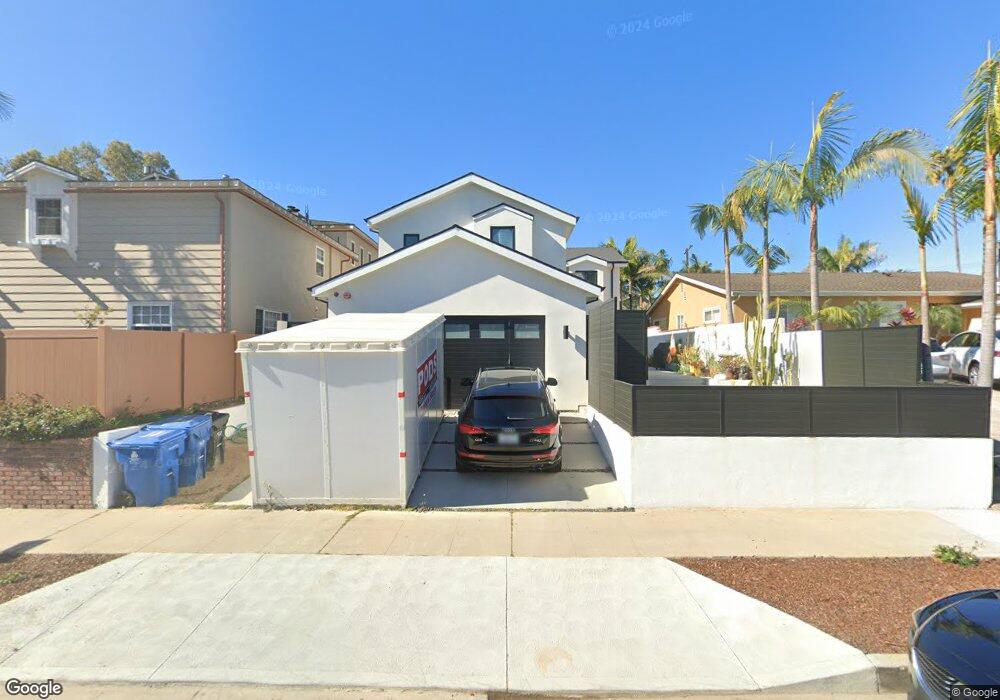
8241 Calabar Ave Playa Del Rey, CA 90293
Estimated Value: $1,975,000 - $2,357,000
4
Beds
2
Baths
2,307
Sq Ft
$934/Sq Ft
Est. Value
About This Home
This home is located at 8241 Calabar Ave, Playa Del Rey, CA 90293 and is currently estimated at $2,154,297, approximately $933 per square foot. 8241 Calabar Ave is a home located in Los Angeles County with nearby schools including Paseo Del Rey Natural Science Magnet, Loyola Village Elementary School, and Kentwood Elementary.
Ownership History
Date
Name
Owned For
Owner Type
Purchase Details
Closed on
Mar 7, 2008
Sold by
Spoerl Stephanie and Stevens Carl D
Bought by
Hallenbrook Darrell
Current Estimated Value
Home Financials for this Owner
Home Financials are based on the most recent Mortgage that was taken out on this home.
Original Mortgage
$740,000
Outstanding Balance
$458,032
Interest Rate
5.62%
Mortgage Type
Purchase Money Mortgage
Estimated Equity
$1,696,265
Purchase Details
Closed on
Jan 17, 2003
Sold by
Spoerl Stephanie
Bought by
Stevens Carl D and Spoerl Stephanie
Home Financials for this Owner
Home Financials are based on the most recent Mortgage that was taken out on this home.
Original Mortgage
$516,000
Interest Rate
5.12%
Purchase Details
Closed on
May 18, 1999
Sold by
Lafevers David R
Bought by
Spoerl Stephanie
Home Financials for this Owner
Home Financials are based on the most recent Mortgage that was taken out on this home.
Original Mortgage
$424,000
Interest Rate
6.9%
Create a Home Valuation Report for This Property
The Home Valuation Report is an in-depth analysis detailing your home's value as well as a comparison with similar homes in the area
Home Values in the Area
Average Home Value in this Area
Purchase History
| Date | Buyer | Sale Price | Title Company |
|---|---|---|---|
| Hallenbrook Darrell | $925,000 | None Available | |
| Hallenbrook Darrell | -- | None Available | |
| Stevens Carl D | -- | Commonwealth Land Title Co | |
| Spoerl Stephanie | $530,000 | Fidelity National Title Co |
Source: Public Records
Mortgage History
| Date | Status | Borrower | Loan Amount |
|---|---|---|---|
| Open | Hallenbrook Darrell | $740,000 | |
| Previous Owner | Stevens Carl D | $516,000 | |
| Previous Owner | Spoerl Stephanie | $424,000 |
Source: Public Records
Tax History Compared to Growth
Tax History
| Year | Tax Paid | Tax Assessment Tax Assessment Total Assessment is a certain percentage of the fair market value that is determined by local assessors to be the total taxable value of land and additions on the property. | Land | Improvement |
|---|---|---|---|---|
| 2025 | $16,056 | $1,332,339 | $985,133 | $347,206 |
| 2024 | $16,056 | $1,306,216 | $965,817 | $340,399 |
| 2023 | $15,749 | $1,280,605 | $946,880 | $333,725 |
| 2022 | $15,021 | $1,255,496 | $928,314 | $327,182 |
| 2021 | $14,833 | $1,230,879 | $910,112 | $320,767 |
| 2019 | $13,836 | $1,147,195 | $883,118 | $264,077 |
| 2018 | $13,463 | $1,103,819 | $865,802 | $238,017 |
| 2016 | $12,459 | $1,026,356 | $832,183 | $194,173 |
| 2015 | $12,277 | $1,010,940 | $819,683 | $191,257 |
| 2014 | $12,318 | $991,138 | $803,627 | $187,511 |
Source: Public Records
Map
Nearby Homes
- 8100 W 83rd St
- 8515 Falmouth Ave Unit 303
- 8512 Tuscany Ave Unit 207
- 8236 Delgany Ave
- 8600 Tuscany Ave Unit 321
- 8600 Tuscany Ave Unit 301
- 8420 Gulana Ave
- 8500 Falmouth Ave Unit 3111
- 8238 W Manchester Ave Unit 108
- 8238 W Manchester Ave Unit 204
- 8105 Redlands St Unit 107
- 8163 Redlands St Unit 24
- 8701 Delgany Ave Unit 110
- 8710 Delgany Ave Unit 17
- 8710 Delgany Ave Unit 7
- 8001 Redlands St Unit 207
- 7844 W 79th St
- 7861 W 80th St
- 7764 Veragua Dr
- 8740 Tuscany Ave Unit 211
- 8115 W 83rd St
- 8231 Calabar Ave
- 8229 Calabar Ave
- 8256 Tuscany Ave
- 8252 Tuscany Ave
- 8260 Tuscany Ave
- 8248 Tuscany Ave
- 8225 Calabar Ave
- 8244 Tuscany Ave
- 8238 Calabar Ave
- 8245 Falmouth Ave
- 8234 Calabar Ave
- 8228 Calabar Ave
- 8118 W 83rd St Unit B
- 8118 W 83rd St
- 8130 W 83rd St Unit 2
- 8130 W 83rd St
- 8240 Tuscany Ave
- 8136 W 83rd St
- 8219 Calabar Ave