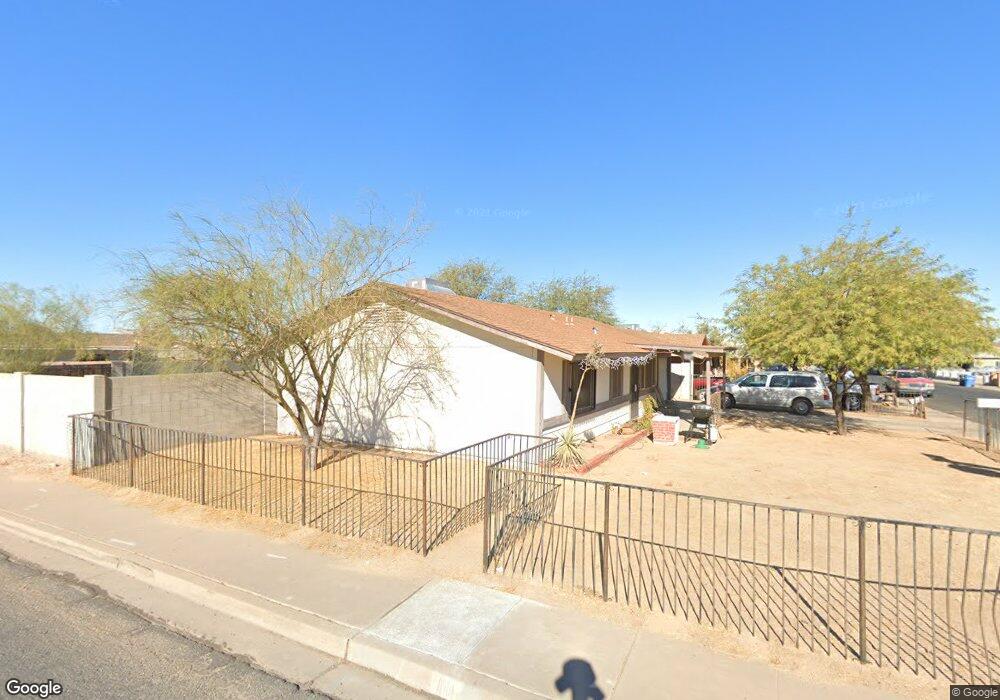
8244 S 26th St Phoenix, AZ 85042
South Mountain NeighborhoodEstimated Value: $228,000 - $326,000
Studio
2
Baths
1,017
Sq Ft
$277/Sq Ft
Est. Value
About This Home
This home is located at 8244 S 26th St, Phoenix, AZ 85042 and is currently estimated at $281,700, approximately $276 per square foot. 8244 S 26th St is a home located in Maricopa County with nearby schools including Cloves C. Campbell, Sr. Elementary School, South Mountain High School, and Phoenix Coding Academy.
Ownership History
Date
Name
Owned For
Owner Type
Purchase Details
Closed on
Dec 9, 2022
Sold by
Garcia Sylvia M
Bought by
Nido-Gonzalez Janso and Nido Alexandra Michelle
Current Estimated Value
Home Financials for this Owner
Home Financials are based on the most recent Mortgage that was taken out on this home.
Original Mortgage
$200,000
Outstanding Balance
$193,349
Interest Rate
7.08%
Mortgage Type
New Conventional
Estimated Equity
$88,351
Purchase Details
Closed on
Aug 10, 2004
Sold by
Garcia Jose J
Bought by
Garcia Sylvia M
Purchase Details
Closed on
Oct 4, 1994
Sold by
Bankers Trust Company
Bought by
Garcia Jose J and Garcia Sylvia M
Home Financials for this Owner
Home Financials are based on the most recent Mortgage that was taken out on this home.
Original Mortgage
$29,900
Interest Rate
8.78%
Mortgage Type
New Conventional
Purchase Details
Closed on
Jun 2, 1994
Sold by
Bosco Michael A
Bought by
Bankers Trust Company
Create a Home Valuation Report for This Property
The Home Valuation Report is an in-depth analysis detailing your home's value as well as a comparison with similar homes in the area
Home Values in the Area
Average Home Value in this Area
Purchase History
| Date | Buyer | Sale Price | Title Company |
|---|---|---|---|
| Nido-Gonzalez Janso | $250,000 | Infinity Title | |
| Garcia Sylvia M | -- | -- | |
| Garcia Jose J | $31,500 | United Title Agency | |
| Bankers Trust Company | -- | First American Title |
Source: Public Records
Mortgage History
| Date | Status | Borrower | Loan Amount |
|---|---|---|---|
| Open | Nido-Gonzalez Janso | $200,000 | |
| Previous Owner | Garcia Jose J | $29,900 |
Source: Public Records
Tax History
| Year | Tax Paid | Tax Assessment Tax Assessment Total Assessment is a certain percentage of the fair market value that is determined by local assessors to be the total taxable value of land and additions on the property. | Land | Improvement |
|---|---|---|---|---|
| 2025 | $931 | $6,886 | -- | -- |
| 2024 | $879 | $6,558 | -- | -- |
| 2023 | $879 | $24,100 | $4,820 | $19,280 |
| 2022 | $861 | $17,110 | $3,420 | $13,690 |
| 2021 | $888 | $15,970 | $3,190 | $12,780 |
| 2020 | $877 | $14,520 | $2,900 | $11,620 |
| 2019 | $847 | $11,870 | $2,370 | $9,500 |
| 2018 | $823 | $9,700 | $1,940 | $7,760 |
| 2017 | $767 | $7,310 | $1,460 | $5,850 |
| 2016 | $728 | $7,560 | $1,510 | $6,050 |
| 2015 | $676 | $6,520 | $1,300 | $5,220 |
Source: Public Records
Map
Nearby Homes
- 8205 S 23rd Place
- 7925 S 24th Way
- 2252 E South Mountain Ave
- 2315 E South Mountain Ave
- 2315 E South Mountain Ave
- 8705 S 24th Place
- 2335 E Allen St
- 7924 S 24th Place
- 2320 E Allen St
- 2510 E Fawn Dr
- 8608 S 28th Place
- 2318 E Harwell Rd
- 2825 E Harwell Rd
- 8618 S 22nd St
- 4208 E Baseline Rd Unit 5
- 2915 E Constance Way
- 3010 E Desert Ln
- 2130 E Beautiful Ln
- 2116 E Beautiful Ln
- 1943 E South Mountain Ave
- 8238 S 26th St
- 8245 S 25th Place
- 8232 S 26th St
- 8239 S 25th Place
- 8243 S 26th St
- 2501 E South Mountain Ave
- 8237 S 26th St
- 8233 S 25th Place
- 8226 S 26th St
- 8231 S 26th St
- 8227 S 25th Place
- 2601 E South Mountain Ave
- 8225 S 26th St
- 8220 S 26th St
- 2537 E South Mountain Ave
- 8244 S 25th Place
- 8238 S 25th Place
- 8221 S 25th Place
- 2611 E South Mountain Ave
- 8232 S 25th Place
Your Personal Tour Guide
Ask me questions while you tour the home.