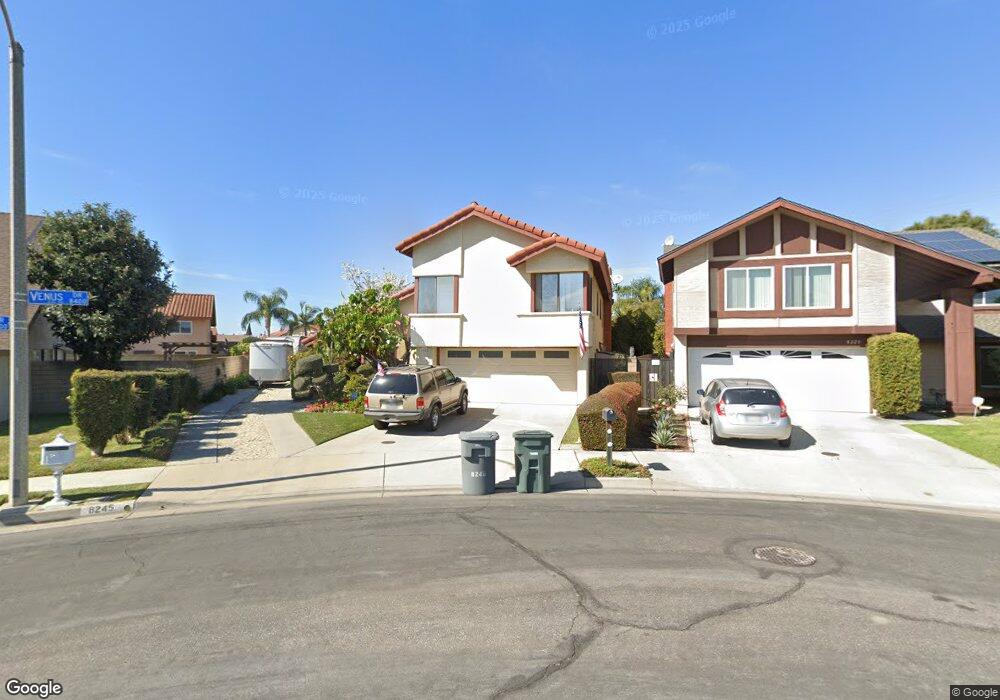
8245 Mars Dr Buena Park, CA 90620
Estimated Value: $1,190,403 - $1,301,000
4
Beds
3
Baths
2,610
Sq Ft
$478/Sq Ft
Est. Value
About This Home
This home is located at 8245 Mars Dr, Buena Park, CA 90620 and is currently estimated at $1,247,601, approximately $478 per square foot. 8245 Mars Dr is a home located in Orange County with nearby schools including Glen H. Dysinger Sr. Elementary School, Dale Jr High School, and Savanna High School.
Ownership History
Date
Name
Owned For
Owner Type
Purchase Details
Closed on
Jul 29, 2013
Sold by
Fiely Charles E and Fiely Nancy E
Bought by
Fiely Charles E and Fiely Nancy E
Current Estimated Value
Purchase Details
Closed on
Feb 24, 1998
Sold by
Salanio Dario S and Salanio Fe G
Bought by
Fiely Charles E and Fiely Nancy Elizabeth
Home Financials for this Owner
Home Financials are based on the most recent Mortgage that was taken out on this home.
Original Mortgage
$137,000
Outstanding Balance
$25,063
Interest Rate
7.02%
Estimated Equity
$1,222,538
Create a Home Valuation Report for This Property
The Home Valuation Report is an in-depth analysis detailing your home's value as well as a comparison with similar homes in the area
Home Values in the Area
Average Home Value in this Area
Purchase History
| Date | Buyer | Sale Price | Title Company |
|---|---|---|---|
| Fiely Charles E | -- | None Available | |
| Fiely Charles E | $274,000 | Fidelity National Title Ins |
Source: Public Records
Mortgage History
| Date | Status | Borrower | Loan Amount |
|---|---|---|---|
| Open | Fiely Charles E | $137,000 |
Source: Public Records
Tax History
| Year | Tax Paid | Tax Assessment Tax Assessment Total Assessment is a certain percentage of the fair market value that is determined by local assessors to be the total taxable value of land and additions on the property. | Land | Improvement |
|---|---|---|---|---|
| 2025 | $5,062 | $437,505 | $160,699 | $276,806 |
| 2024 | $5,062 | $428,927 | $157,548 | $271,379 |
| 2023 | $4,936 | $420,517 | $154,459 | $266,058 |
| 2022 | $4,872 | $412,272 | $151,430 | $260,842 |
| 2021 | $4,802 | $404,189 | $148,461 | $255,728 |
| 2020 | $4,773 | $400,045 | $146,939 | $253,106 |
| 2019 | $4,654 | $392,201 | $144,057 | $248,144 |
| 2018 | $4,569 | $384,511 | $141,232 | $243,279 |
| 2017 | $4,425 | $376,972 | $138,463 | $238,509 |
| 2016 | $4,340 | $369,581 | $135,748 | $233,833 |
| 2015 | $4,291 | $364,030 | $133,709 | $230,321 |
| 2014 | $4,075 | $356,900 | $131,090 | $225,810 |
Source: Public Records
Map
Nearby Homes
- 8224 Guava Ave
- 2758 W Stockton Ave
- 8572 Corsica Ln
- 2780 W Stanley Place
- 2870 W Monroe Ave
- 330 N Colgate St
- 7884 Adams Way
- 927 N Magnolia Ave
- 7704 Lotus Cir
- 1001 N Hanover Place
- 7720 Crescent Ave
- 8223 Cyclamen Way
- 2553 W West Glenoaks Ave
- 101 Laxore St Unit 205
- 8049 Coral Bell Way
- 2770 W Lincoln Ave Unit 55
- 243 N Magnolia Ave Unit 5
- 8014 Calendula Dr
- 200 N Grand Ave Unit 57
- 8333 Portulaca Way
Your Personal Tour Guide
Ask me questions while you tour the home.