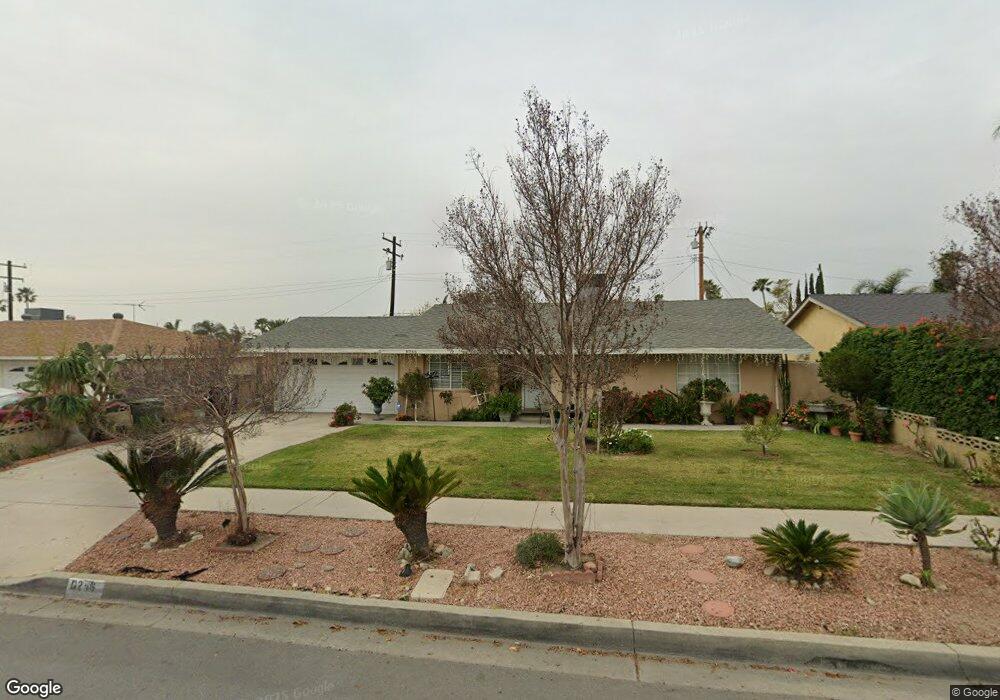
8246 Alder Ave Fontana, CA 92335
Estimated Value: $556,671 - $624,000
3
Beds
2
Baths
1,522
Sq Ft
$393/Sq Ft
Est. Value
About This Home
This home is located at 8246 Alder Ave, Fontana, CA 92335 and is currently estimated at $598,668, approximately $393 per square foot. 8246 Alder Ave is a home located in San Bernardino County with nearby schools including South Tamarind Elementary School, Fontana Middle School, and Fontana High School.
Ownership History
Date
Name
Owned For
Owner Type
Purchase Details
Closed on
Oct 20, 2021
Sold by
Zamora Marco and Zamora-Salgado Armando D
Bought by
La Barca Revocable Living Trust and Zamora-Salgado
Current Estimated Value
Purchase Details
Closed on
Sep 30, 2014
Sold by
Zamora Marco A
Bought by
Zamora Marco A and Zamora Salgado Armando D
Purchase Details
Closed on
Feb 20, 2001
Sold by
Zamora Jorge
Bought by
Zamora Marco
Home Financials for this Owner
Home Financials are based on the most recent Mortgage that was taken out on this home.
Original Mortgage
$119,770
Interest Rate
7.21%
Mortgage Type
FHA
Purchase Details
Closed on
Oct 15, 1994
Sold by
Ceja Roberto
Bought by
Zamora Marco and Zamora Jorge
Home Financials for this Owner
Home Financials are based on the most recent Mortgage that was taken out on this home.
Original Mortgage
$119,325
Interest Rate
7.61%
Mortgage Type
FHA
Create a Home Valuation Report for This Property
The Home Valuation Report is an in-depth analysis detailing your home's value as well as a comparison with similar homes in the area
Purchase History
| Date | Buyer | Sale Price | Title Company |
|---|---|---|---|
| La Barca Revocable Living Trust | -- | None Listed On Document | |
| Zamora Marco A | -- | None Available | |
| Zamora Marco | -- | Benefit Land Title | |
| Zamora Marco | -- | American Title Ins Co |
Source: Public Records
Mortgage History
| Date | Status | Borrower | Loan Amount |
|---|---|---|---|
| Previous Owner | Zamora Marco | $119,770 | |
| Previous Owner | Zamora Marco | $119,325 |
Source: Public Records
Tax History
| Year | Tax Paid | Tax Assessment Tax Assessment Total Assessment is a certain percentage of the fair market value that is determined by local assessors to be the total taxable value of land and additions on the property. | Land | Improvement |
|---|---|---|---|---|
| 2025 | $2,717 | $159,547 | $39,887 | $119,660 |
| 2024 | $2,535 | $156,419 | $39,105 | $117,314 |
| 2023 | $2,461 | $153,352 | $38,338 | $115,014 |
| 2022 | $2,412 | $150,345 | $37,586 | $112,759 |
| 2021 | $2,291 | $147,397 | $36,849 | $110,548 |
| 2020 | $2,370 | $145,885 | $36,471 | $109,414 |
| 2019 | $1,833 | $143,025 | $35,756 | $107,269 |
| 2018 | $1,835 | $140,221 | $35,055 | $105,166 |
| 2017 | $1,799 | $137,472 | $34,368 | $103,104 |
| 2016 | $1,747 | $134,776 | $33,694 | $101,082 |
| 2015 | $1,708 | $132,752 | $33,188 | $99,564 |
| 2014 | $1,694 | $130,152 | $32,538 | $97,614 |
Source: Public Records
Map
Nearby Homes
- 17748 Owen St
- 17824 Ivy Ave
- 17844 Owen St
- 17640 Foothill Blvd
- 17425 Arrow Blvd Unit 25
- 17548 Court St
- 17923 Dorsey Way
- 18173 Mccauley St
- 8725 Boxwood Ct
- 17432 Fairview Rd
- 18206 Seville Ave
- 18236 Owen St
- 18090 Orange Way
- 7887 Kempster Ave
- 8573 Williams Rd
- 17320 Anastasia Ave
- 8787 Locust Ave Unit 24
- 8787 Locust Ave Unit 69
- 8787 Locust Ave Unit 130
- 8787 Locust Ave Unit 1
- 8236 Alder Ave
- 8264 Alder Ave
- 8245 Boxwood Ave
- 8255 Boxwood Ave
- 8226 Alder Ave
- 8235 Boxwood Ave
- 17711 Ivy Ave
- 8270 Alder Ave
- 8265 Boxwood Ave
- 8225 Boxwood Ave
- 17712 Upland Ave
- 8216 Alder Ave
- 8275 Boxwood Ave
- 17721 Ivy Ave
- 8284 Alder Ave
- 17724 Upland Ave
- 8206 Alder Ave Unit A
- 8206 Alder Ave Unit A, B
- 8206 Alder Ave
- 17656 Ivy Ave
Your Personal Tour Guide
Ask me questions while you tour the home.