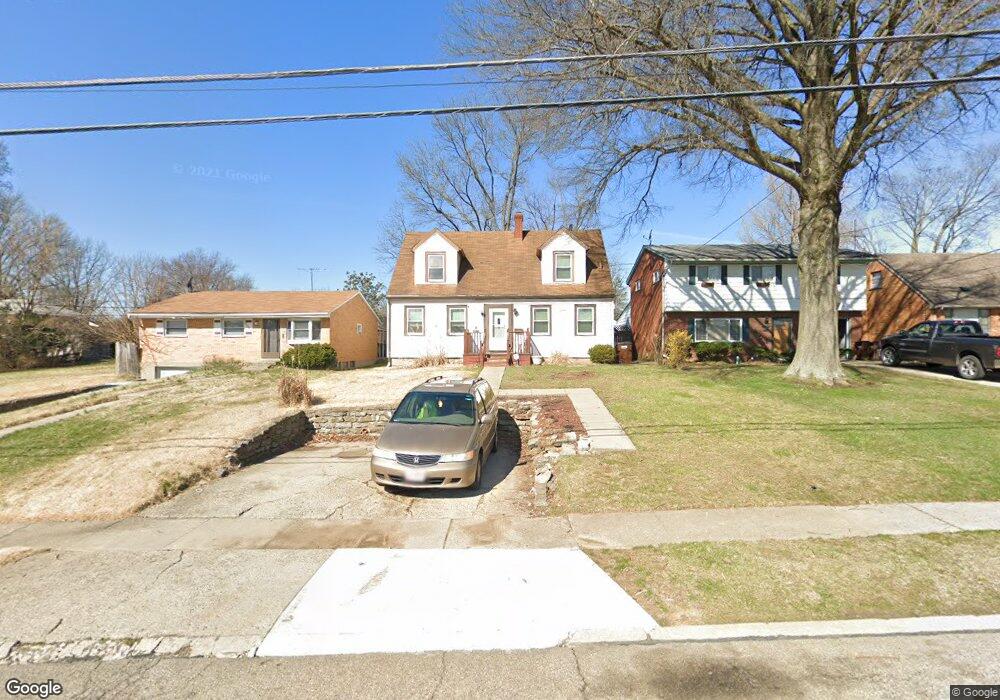
8249 Bobolink Ave Cincinnati, OH 45231
Estimated Value: $190,000 - $281,000
3
Beds
1
Bath
1,865
Sq Ft
$121/Sq Ft
Est. Value
About This Home
This home is located at 8249 Bobolink Ave, Cincinnati, OH 45231 and is currently estimated at $226,333, approximately $121 per square foot. 8249 Bobolink Ave is a home located in Hamilton County with nearby schools including North College Hill Elementary School, North College Hill Middle School, and North College Hill High School.
Ownership History
Date
Name
Owned For
Owner Type
Purchase Details
Closed on
Jul 25, 2019
Sold by
Bank Of New York Mellon
Bought by
Accenti Tech Solution Llc
Current Estimated Value
Purchase Details
Closed on
Apr 23, 2019
Sold by
Haley Bridgette
Bought by
The Bank Of New York Mellon and Cwabs Inc
Purchase Details
Closed on
Jul 23, 2004
Sold by
Enderle Richard A and Enderle Mary Alice
Bought by
Haley Bridgette
Home Financials for this Owner
Home Financials are based on the most recent Mortgage that was taken out on this home.
Original Mortgage
$75,200
Interest Rate
6.6%
Mortgage Type
New Conventional
Create a Home Valuation Report for This Property
The Home Valuation Report is an in-depth analysis detailing your home's value as well as a comparison with similar homes in the area
Home Values in the Area
Average Home Value in this Area
Purchase History
| Date | Buyer | Sale Price | Title Company |
|---|---|---|---|
| Accenti Tech Solution Llc | $57,960 | Nova Title Agency Inc | |
| The Bank Of New York Mellon | $60,000 | None Available | |
| Haley Bridgette | $94,000 | Prominent Title Agency Llc |
Source: Public Records
Mortgage History
| Date | Status | Borrower | Loan Amount |
|---|---|---|---|
| Previous Owner | Haley Bridgette | $75,200 | |
| Closed | Haley Bridgette | $18,800 |
Source: Public Records
Tax History
| Year | Tax Paid | Tax Assessment Tax Assessment Total Assessment is a certain percentage of the fair market value that is determined by local assessors to be the total taxable value of land and additions on the property. | Land | Improvement |
|---|---|---|---|---|
| 2025 | $2,247 | $42,231 | $7,245 | $34,986 |
| 2023 | $2,228 | $42,231 | $7,245 | $34,986 |
| 2022 | $2,074 | $28,148 | $5,478 | $22,670 |
| 2021 | $2,479 | $28,148 | $5,478 | $22,670 |
| 2020 | $1,780 | $28,148 | $5,478 | $22,670 |
| 2019 | $1,752 | $24,693 | $4,806 | $19,887 |
| 2018 | $1,694 | $24,693 | $4,806 | $19,887 |
| 2017 | $1,599 | $24,693 | $4,806 | $19,887 |
| 2016 | $1,543 | $25,253 | $6,514 | $18,739 |
| 2015 | $1,547 | $25,253 | $6,514 | $18,739 |
| 2014 | $1,545 | $25,253 | $6,514 | $18,739 |
| 2013 | $1,595 | $26,866 | $6,930 | $19,936 |
Source: Public Records
Map
Nearby Homes
- 7923 Bobolink Dr
- 7929 Cherrywood Ct
- 1280 Brushwood Ave
- 1202 Ashmore Ct
- 7873 Bobolink Dr
- 6666 Orleans Ct
- 7909 Burgundy Ln
- 6669 Kirkland Dr
- 1090 W Galbraith Rd
- 6765 Richard Ave
- 8609 Balboa Dr
- 1285 Landis Ln
- 1144 Hempstead Dr
- 1476 Foxwood Dr
- 1025 Eastgate Dr
- 6538 S Oak Knoll Dr
- 1148 Hollywood Ave
- 8433 Jonfred Ct
- 1116 Madeleine Cir
- 8663 Mockingbird Ln
- 8269 Bobolink Ave
- 8247 Bobolink Ave
- 8271 Bobolink Ave
- 8247 Bobolink Dr
- 0 Bobolink Dr
- 8250 Carrol Ave
- 8273 Bobolink Ave
- 8246 Carrol Ave
- 8254 Carrol Ave
- 8240 Carrol Ave
- 8283 Bobolink Ave
- 8268 Carrol Ave
- 1264 W Galbraith Rd
- 1260 W Galbraith Rd
- 1266 W Galbraith Rd
- 1266 W Galbraith Rd
- 8248 Bobolink Ave
- 8254 Bobolink Ave
- 8240 Bobolink Ave
- 8268 Bobolink Dr
Your Personal Tour Guide
Ask me questions while you tour the home.