Estimated Value: $1,890,000 - $2,248,000
3
Beds
2
Baths
2,073
Sq Ft
$999/Sq Ft
Est. Value
About This Home
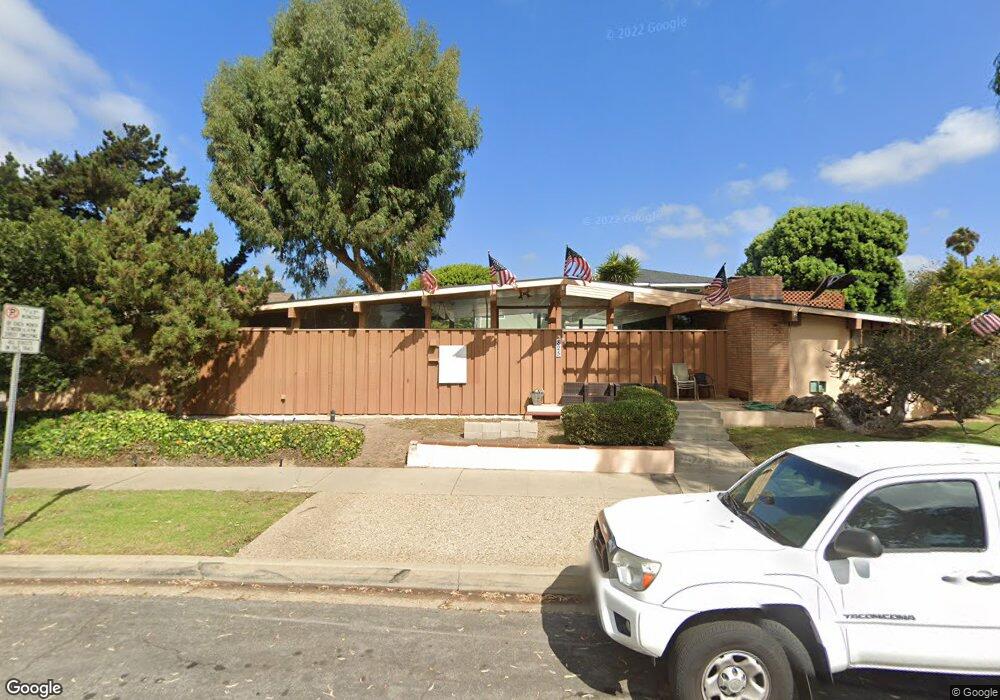
This home is located at 825 12th St, Huntington Beach, CA 92648 and is currently estimated at $2,070,151, approximately $998 per square foot. 825 12th St is a home located in Orange County with nearby schools including Agnes L. Smith Elementary, Ethel Dwyer Middle, and Huntington Beach High School.
Ownership History
Date
Name
Owned For
Owner Type
Purchase Details
Closed on
Mar 29, 2004
Sold by
Mason Jeffrey A
Bought by
Mason Jeffrey A and Jeffrey A Mason 1999 Trust
Current Estimated Value
Purchase Details
Closed on
Feb 9, 2004
Sold by
Mason Bernard
Bought by
Mason Jeffrey A
Purchase Details
Closed on
Feb 8, 2004
Sold by
Mason Bernard
Bought by
Mason Jeffrey A
Purchase Details
Closed on
Jan 27, 2004
Sold by
Mason Elsie
Bought by
Mason Bernard and Bernard Mason Qualified Personal Residen
Purchase Details
Closed on
Aug 25, 1999
Sold by
Bernard Mason
Bought by
Mason Bernard and Bernard Mason Qualified Personal Residen
Create a Home Valuation Report for This Property
The Home Valuation Report is an in-depth analysis detailing your home's value as well as a comparison with similar homes in the area
Home Values in the Area
Average Home Value in this Area
Purchase History
| Date | Buyer | Sale Price | Title Company |
|---|---|---|---|
| Mason Jeffrey A | -- | -- | |
| Mason Jeffrey A | -- | -- | |
| Mason Jeffrey A | -- | -- | |
| Mason Bernard | -- | -- | |
| Mason Bernard | -- | -- | |
| Mason Bernard | -- | -- | |
| Mason Bernard | -- | -- | |
| Mason Bernard | -- | -- |
Source: Public Records
Tax History Compared to Growth
Tax History
| Year | Tax Paid | Tax Assessment Tax Assessment Total Assessment is a certain percentage of the fair market value that is determined by local assessors to be the total taxable value of land and additions on the property. | Land | Improvement |
|---|---|---|---|---|
| 2025 | $1,847 | $134,590 | $51,448 | $83,142 |
| 2024 | $1,847 | $131,951 | $50,439 | $81,512 |
| 2023 | $1,802 | $129,364 | $49,450 | $79,914 |
| 2022 | $1,754 | $126,828 | $48,480 | $78,348 |
| 2021 | $1,723 | $124,342 | $47,530 | $76,812 |
| 2020 | $1,710 | $123,068 | $47,043 | $76,025 |
| 2019 | $1,694 | $120,655 | $46,120 | $74,535 |
| 2018 | $1,669 | $118,290 | $45,216 | $73,074 |
| 2017 | $1,647 | $115,971 | $44,329 | $71,642 |
| 2016 | $1,583 | $113,698 | $43,460 | $70,238 |
| 2015 | $1,566 | $111,991 | $42,808 | $69,183 |
| 2014 | $1,533 | $109,798 | $41,970 | $67,828 |
Source: Public Records
Map
Nearby Homes