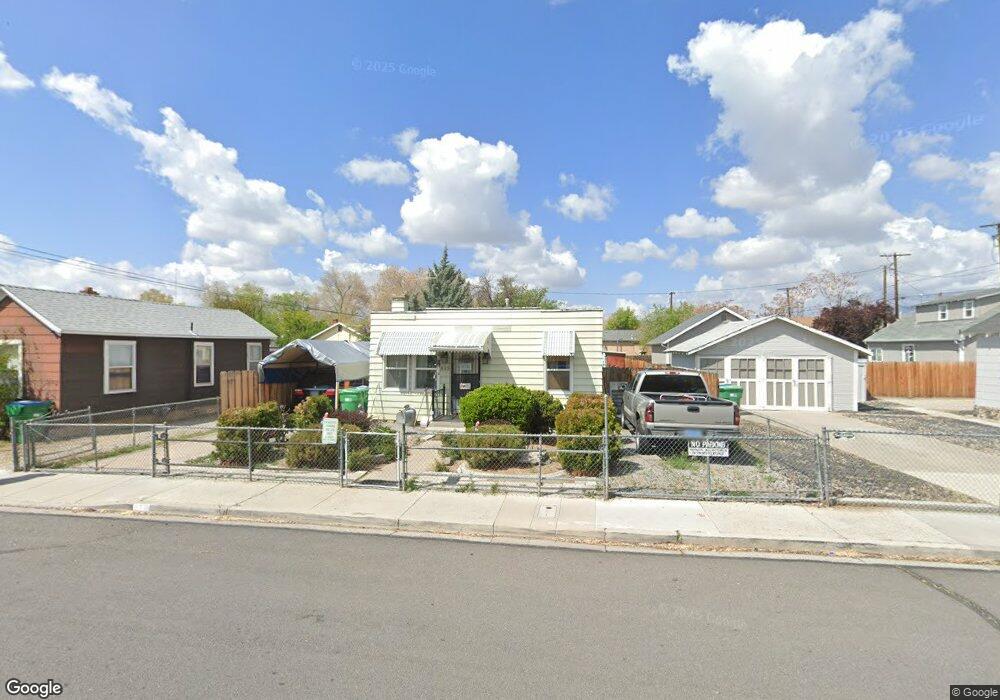
825 12th St Sparks, NV 89431
Downtown Sparks NeighborhoodEstimated Value: $292,000 - $333,000
2
Beds
1
Bath
880
Sq Ft
$353/Sq Ft
Est. Value
About This Home
This home is located at 825 12th St, Sparks, NV 89431 and is currently estimated at $310,664, approximately $353 per square foot. 825 12th St is a home located in Washoe County with nearby schools including Robert Mitchell Elementary School, Sparks Middle School, and Sparks High School.
Ownership History
Date
Name
Owned For
Owner Type
Purchase Details
Closed on
Jan 19, 2018
Sold by
Pfister John H and Pfister Valarie K
Bought by
Munoz Castro Roberto and Aquil Ann Patricia
Current Estimated Value
Home Financials for this Owner
Home Financials are based on the most recent Mortgage that was taken out on this home.
Original Mortgage
$166,920
Outstanding Balance
$143,667
Interest Rate
4.75%
Mortgage Type
FHA
Estimated Equity
$166,997
Purchase Details
Closed on
Nov 17, 2004
Sold by
Farrington Franklin D and Farrington Sandra Lee
Bought by
Pfister John H and Pfister Valerie K
Home Financials for this Owner
Home Financials are based on the most recent Mortgage that was taken out on this home.
Original Mortgage
$98,000
Interest Rate
5.65%
Mortgage Type
Unknown
Purchase Details
Closed on
Jul 8, 2002
Sold by
Farrington Franklin D
Bought by
Farrington Franklin D and Farrington Sandra Lee
Purchase Details
Closed on
Sep 5, 2000
Sold by
Jakowatz Getta L
Bought by
Jakowatz Getta L and Farrington Frank
Create a Home Valuation Report for This Property
The Home Valuation Report is an in-depth analysis detailing your home's value as well as a comparison with similar homes in the area
Home Values in the Area
Average Home Value in this Area
Purchase History
| Date | Buyer | Sale Price | Title Company |
|---|---|---|---|
| Munoz Castro Roberto | $170,000 | First Centennial Reno | |
| Pfister John H | $128,000 | Stewart Title Of Northern Nv | |
| Farrington Franklin D | -- | -- | |
| Jakowatz Getta L | -- | -- |
Source: Public Records
Mortgage History
| Date | Status | Borrower | Loan Amount |
|---|---|---|---|
| Open | Munoz Castro Roberto | $166,920 | |
| Previous Owner | Pfister John H | $98,000 |
Source: Public Records
Tax History Compared to Growth
Tax History
| Year | Tax Paid | Tax Assessment Tax Assessment Total Assessment is a certain percentage of the fair market value that is determined by local assessors to be the total taxable value of land and additions on the property. | Land | Improvement |
|---|---|---|---|---|
| 2025 | $532 | $42,792 | $31,675 | $11,117 |
| 2024 | $532 | $38,807 | $27,860 | $10,947 |
| 2023 | $517 | $40,756 | $30,625 | $10,131 |
| 2022 | $480 | $30,949 | $22,680 | $8,269 |
| 2021 | $444 | $24,325 | $16,275 | $8,050 |
| 2020 | $417 | $23,713 | $15,820 | $7,893 |
| 2019 | $397 | $21,113 | $13,615 | $7,498 |
| 2018 | $379 | $17,405 | $10,220 | $7,185 |
| 2017 | $365 | $16,609 | $9,555 | $7,054 |
| 2016 | $355 | $14,503 | $7,420 | $7,083 |
| 2015 | $355 | $12,785 | $5,775 | $7,010 |
| 2014 | $344 | $10,401 | $3,815 | $6,586 |
| 2013 | -- | $9,116 | $2,730 | $6,386 |
Source: Public Records
Map
Nearby Homes