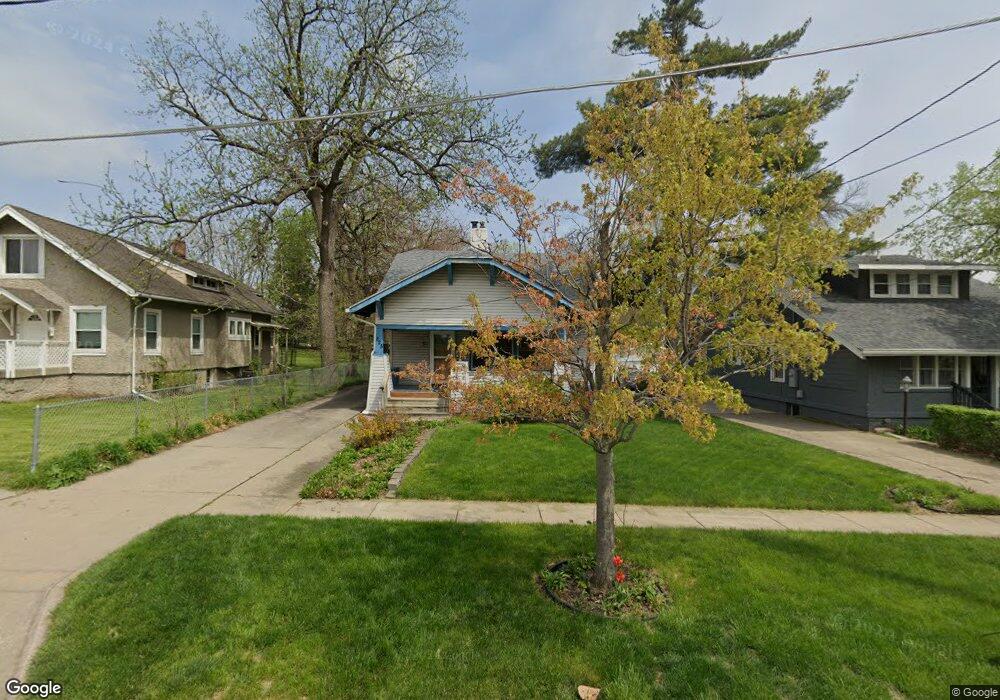
825 29th St Des Moines, IA 50312
Woodland Heights NeighborhoodEstimated Value: $252,000 - $304,000
4
Beds
2
Baths
1,625
Sq Ft
$170/Sq Ft
Est. Value
About This Home
This home is located at 825 29th St, Des Moines, IA 50312 and is currently estimated at $275,481, approximately $169 per square foot. 825 29th St is a home located in Polk County with nearby schools including Greenwood Elementary School and Roosevelt High School.
Ownership History
Date
Name
Owned For
Owner Type
Purchase Details
Closed on
May 29, 2001
Sold by
Johnson Jerry L and Johnson Felicia M
Bought by
Shaffer Steven T and Shaffer Kimberlee R
Current Estimated Value
Home Financials for this Owner
Home Financials are based on the most recent Mortgage that was taken out on this home.
Original Mortgage
$87,253
Outstanding Balance
$32,270
Interest Rate
7.23%
Estimated Equity
$243,211
Create a Home Valuation Report for This Property
The Home Valuation Report is an in-depth analysis detailing your home's value as well as a comparison with similar homes in the area
Home Values in the Area
Average Home Value in this Area
Purchase History
| Date | Buyer | Sale Price | Title Company |
|---|---|---|---|
| Shaffer Steven T | $104,500 | -- |
Source: Public Records
Mortgage History
| Date | Status | Borrower | Loan Amount |
|---|---|---|---|
| Open | Shaffer Steven T | $87,253 |
Source: Public Records
Tax History Compared to Growth
Tax History
| Year | Tax Paid | Tax Assessment Tax Assessment Total Assessment is a certain percentage of the fair market value that is determined by local assessors to be the total taxable value of land and additions on the property. | Land | Improvement |
|---|---|---|---|---|
| 2025 | $4,646 | $258,200 | $52,100 | $206,100 |
| 2024 | $4,646 | $246,600 | $49,600 | $197,000 |
| 2023 | $4,382 | $246,600 | $49,600 | $197,000 |
| 2022 | $4,346 | $194,800 | $41,100 | $153,700 |
| 2021 | $4,122 | $194,800 | $41,100 | $153,700 |
| 2020 | $4,278 | $173,800 | $36,900 | $136,900 |
| 2019 | $3,988 | $173,800 | $36,900 | $136,900 |
| 2018 | $3,942 | $156,900 | $33,000 | $123,900 |
| 2017 | $3,592 | $156,900 | $33,000 | $123,900 |
| 2016 | $3,494 | $141,300 | $29,600 | $111,700 |
| 2015 | $3,494 | $141,300 | $29,600 | $111,700 |
| 2014 | $2,850 | $120,200 | $25,000 | $95,200 |
Source: Public Records
Map
Nearby Homes