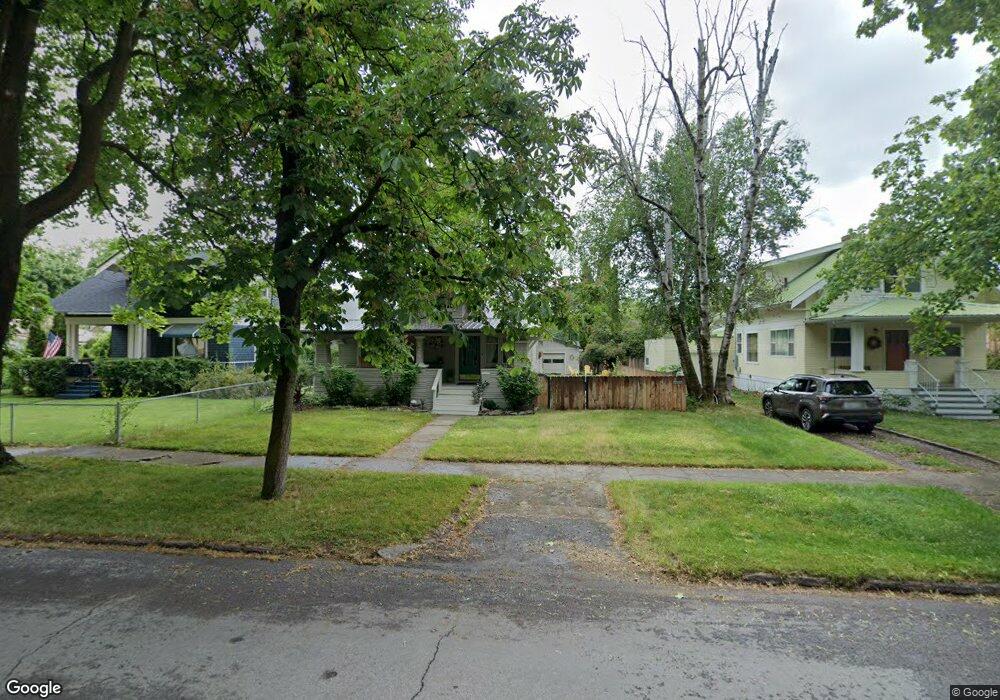
825 3rd Ave E Kalispell, MT 59901
Estimated Value: $509,000 - $583,641
4
Beds
3
Baths
2,444
Sq Ft
$223/Sq Ft
Est. Value
About This Home
This home is located at 825 3rd Ave E, Kalispell, MT 59901 and is currently estimated at $543,910, approximately $222 per square foot. 825 3rd Ave E is a home located in Flathead County with nearby schools including Cornelius Hedges School, Kalispell Middle School, and Flathead High School.
Ownership History
Date
Name
Owned For
Owner Type
Purchase Details
Closed on
Apr 4, 2023
Sold by
Snell Grant S
Bought by
Grant S Snell Trust
Current Estimated Value
Purchase Details
Closed on
Nov 30, 2015
Sold by
Snell Grant and Shultes Jenna
Bought by
Snell Grant S and Snell Jenna A
Home Financials for this Owner
Home Financials are based on the most recent Mortgage that was taken out on this home.
Original Mortgage
$193,600
Interest Rate
3.45%
Mortgage Type
Adjustable Rate Mortgage/ARM
Purchase Details
Closed on
May 20, 2008
Sold by
Scarff Gregory Ames and Scarff Peggy A
Bought by
Snell Grant and Shultes Jenna
Home Financials for this Owner
Home Financials are based on the most recent Mortgage that was taken out on this home.
Original Mortgage
$213,600
Interest Rate
5.88%
Mortgage Type
New Conventional
Create a Home Valuation Report for This Property
The Home Valuation Report is an in-depth analysis detailing your home's value as well as a comparison with similar homes in the area
Purchase History
| Date | Buyer | Sale Price | Title Company |
|---|---|---|---|
| Grant S Snell Trust | -- | -- | |
| Snell Grant S | -- | Ftm | |
| Snell Grant | -- | Stewart Title Of Flathead Co |
Source: Public Records
Mortgage History
| Date | Status | Borrower | Loan Amount |
|---|---|---|---|
| Previous Owner | Snell Grant S | $193,600 | |
| Previous Owner | Snell Grant | $213,600 |
Source: Public Records
Tax History
| Year | Tax Paid | Tax Assessment Tax Assessment Total Assessment is a certain percentage of the fair market value that is determined by local assessors to be the total taxable value of land and additions on the property. | Land | Improvement |
|---|---|---|---|---|
| 2025 | $3,421 | $614,500 | $0 | $0 |
| 2024 | $3,577 | $459,400 | $0 | $0 |
| 2023 | $3,994 | $459,400 | $0 | $0 |
| 2022 | $3,792 | $326,700 | $0 | $0 |
| 2021 | $3,788 | $326,700 | $0 | $0 |
| 2020 | $3,454 | $279,100 | $0 | $0 |
| 2019 | $3,467 | $279,100 | $0 | $0 |
| 2018 | $3,241 | $247,470 | $0 | $0 |
| 2017 | $2,677 | $255,400 | $0 | $0 |
| 2016 | $2,476 | $198,800 | $0 | $0 |
| 2015 | $2,476 | $198,800 | $0 | $0 |
| 2014 | $2,855 | $141,033 | $0 | $0 |
Source: Public Records
Map
Nearby Homes
- 723 5th Ave E Unit 318-S
- 442 4th Ave E
- 519 1st Ave E
- 715 8th St E
- 484 1st Ave E
- 1305 4th Ave E
- 1312 2nd Ave E
- 826 11th St E
- 209 12th St W
- 635 3rd Ave W
- 442 2nd Ave W
- NHN 11th St W
- 51 Selders Ln
- 184 Lawrence Ln
- 31 5th Ave E
- 236 3rd Ave W Unit 2S
- 403 E Center St
- 3953 US Highway 93 S
- 1710 8th Ave E
- 100 Woodlands Way Unit S301
Your Personal Tour Guide
Ask me questions while you tour the home.