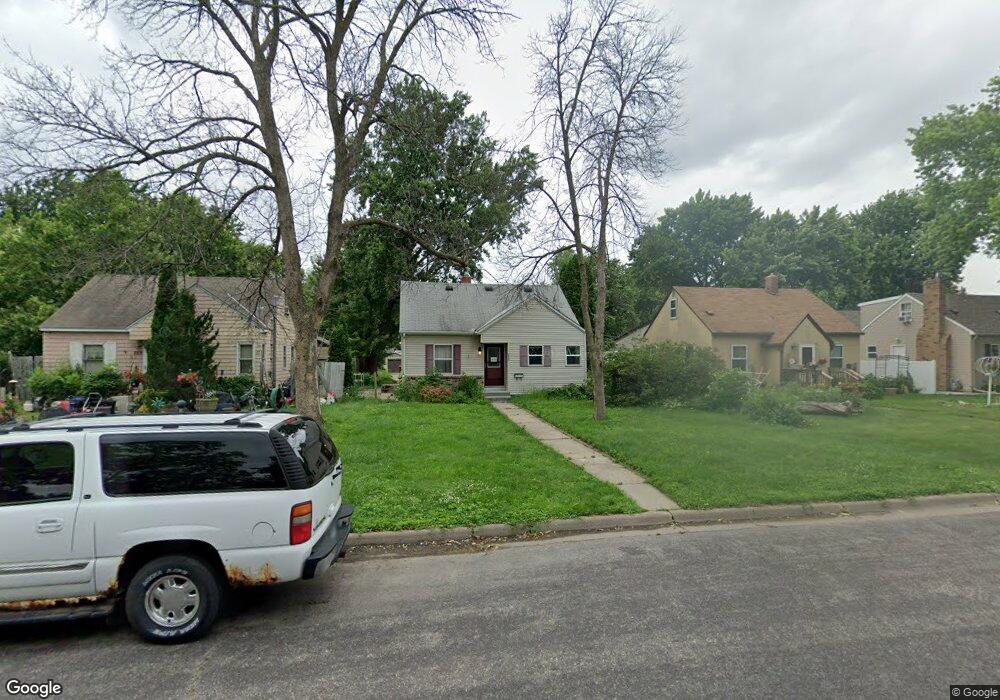
825 Ashland Ave Saint Paul Park, MN 55071
Estimated Value: $284,000 - $308,000
4
Beds
2
Baths
1,789
Sq Ft
$165/Sq Ft
Est. Value
About This Home
This home is located at 825 Ashland Ave, Saint Paul Park, MN 55071 and is currently estimated at $294,625, approximately $164 per square foot. 825 Ashland Ave is a home located in Washington County with nearby schools including Pullman Elementary School, Oltman Middle School, and Park Senior High School.
Ownership History
Date
Name
Owned For
Owner Type
Purchase Details
Closed on
Sep 25, 2020
Sold by
Killey Emmett J and Killey Danielle J
Bought by
Weisman Casey
Current Estimated Value
Home Financials for this Owner
Home Financials are based on the most recent Mortgage that was taken out on this home.
Original Mortgage
$208,560
Outstanding Balance
$185,503
Interest Rate
2.9%
Mortgage Type
New Conventional
Estimated Equity
$109,122
Purchase Details
Closed on
Jul 8, 2013
Sold by
Diephouse Harold D and Diephouse Rita
Bought by
Killey Emmett J and Killey Danielle J
Home Financials for this Owner
Home Financials are based on the most recent Mortgage that was taken out on this home.
Original Mortgage
$151,900
Interest Rate
3.83%
Mortgage Type
New Conventional
Purchase Details
Closed on
Sep 17, 2010
Sold by
Federal Home Loan Mortgage Corporation
Bought by
Lindstrom John C and Lindstrom Sheila A
Purchase Details
Closed on
Apr 28, 2003
Sold by
Meyer Maurice F and Meyer Naomi M
Bought by
Torres Camilo and Saldivar Maria Sanches
Create a Home Valuation Report for This Property
The Home Valuation Report is an in-depth analysis detailing your home's value as well as a comparison with similar homes in the area
Home Values in the Area
Average Home Value in this Area
Purchase History
| Date | Buyer | Sale Price | Title Company |
|---|---|---|---|
| Weisman Casey | $237,000 | First American Title Ins Co | |
| Killey Emmett J | $155,000 | Multiple | |
| Lindstrom John C | $65,316 | -- | |
| Torres Camilo | $164,900 | -- |
Source: Public Records
Mortgage History
| Date | Status | Borrower | Loan Amount |
|---|---|---|---|
| Open | Weisman Casey | $208,560 | |
| Previous Owner | Killey Emmett J | $151,900 |
Source: Public Records
Tax History Compared to Growth
Tax History
| Year | Tax Paid | Tax Assessment Tax Assessment Total Assessment is a certain percentage of the fair market value that is determined by local assessors to be the total taxable value of land and additions on the property. | Land | Improvement |
|---|---|---|---|---|
| 2024 | $3,136 | $252,300 | $80,000 | $172,300 |
| 2023 | $3,136 | $248,600 | $91,000 | $157,600 |
| 2022 | $2,606 | $238,000 | $90,100 | $147,900 |
| 2021 | $2,526 | $198,100 | $75,000 | $123,100 |
| 2020 | $2,402 | $195,600 | $85,000 | $110,600 |
| 2019 | $2,080 | $184,800 | $76,000 | $108,800 |
| 2018 | $2,036 | $154,700 | $63,000 | $91,700 |
| 2017 | $1,852 | $151,500 | $63,000 | $88,500 |
| 2016 | $1,880 | $143,100 | $58,000 | $85,100 |
| 2015 | $1,596 | $108,800 | $44,700 | $64,100 |
| 2013 | -- | $86,100 | $34,500 | $51,600 |
Source: Public Records
Map
Nearby Homes
- 801 Summit Ave
- 1033 Portland Ave
- 1200 Summit Ave
- TBD Broadway Ave
- 1637 Pullman Ave
- 11XX 1st St
- 1601 14th Ave
- 6444 Genevieve Trail
- 1142 1st St
- 1410 5th St
- 6745 Wildflower Dr S
- 6538 Genevieve Trail
- 6283 Highland Hills Ln S
- 6291 Highland Hills Ln S
- 6266 Highland Hills Ln S
- 6295 Highland Hills Ln S
- 6284 Highland Hills Ln S
- 6290 Highland Hills Ln S
- 6296 Highland Hills Ln S
- 6961 E Point Douglas Rd S
- 825 Ashland Ave
- 821 Ashland Ave
- 829 Ashland Ave
- 817 Ashland Ave
- 831 Ashland Ave
- 826 Holley Ave
- 820 Holley Ave
- 828 Holley Ave
- 836 836 Ashland Ave
- 816 Holley Ave
- 809 Ashland Ave
- 836 Holley Ave
- 812 Holley Ave
- 826 Ashland Ave
- 845 Ashland Ave
- 816 Ashland Ave
- 845 Ashland Ave
- 830 Ashland Ave
- 805 Ashland Ave
- 808 Holley Ave