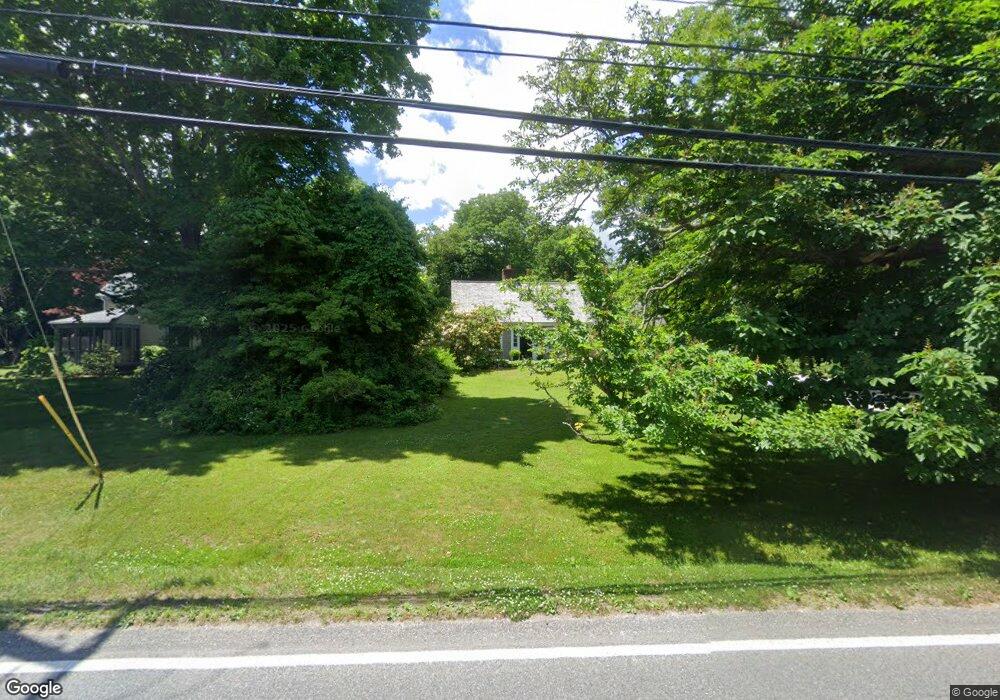
825 Main St West Barnstable, MA 02668
West Barnstable NeighborhoodEstimated Value: $753,000 - $822,000
3
Beds
1
Bath
1,201
Sq Ft
$655/Sq Ft
Est. Value
About This Home
This home is located at 825 Main St, West Barnstable, MA 02668 and is currently estimated at $787,133, approximately $655 per square foot. 825 Main St is a home located in Barnstable County with nearby schools including West Barnstable Elementary School, Barnstable United Elementary School, and Barnstable Intermediate School.
Ownership History
Date
Name
Owned For
Owner Type
Purchase Details
Closed on
Sep 9, 1997
Sold by
Tracey Marion J
Bought by
Trombley Peter A
Current Estimated Value
Purchase Details
Closed on
May 23, 1997
Sold by
Salvi Rt and Catani Roland L
Bought by
Orbe Octavius A and Orbe Eleanor C
Purchase Details
Closed on
Nov 29, 1989
Sold by
Wohlke Barbara L
Bought by
Long Susan White
Create a Home Valuation Report for This Property
The Home Valuation Report is an in-depth analysis detailing your home's value as well as a comparison with similar homes in the area
Home Values in the Area
Average Home Value in this Area
Purchase History
| Date | Buyer | Sale Price | Title Company |
|---|---|---|---|
| Trombley Peter A | $53,750 | -- | |
| Orbe Octavius A | $51,000 | -- | |
| Long Susan White | $137,500 | -- |
Source: Public Records
Mortgage History
| Date | Status | Borrower | Loan Amount |
|---|---|---|---|
| Open | Long Susan White | $208,000 | |
| Closed | Long Susan White | $20,000 | |
| Closed | Long Susan White | $110,000 |
Source: Public Records
Tax History
| Year | Tax Paid | Tax Assessment Tax Assessment Total Assessment is a certain percentage of the fair market value that is determined by local assessors to be the total taxable value of land and additions on the property. | Land | Improvement |
|---|---|---|---|---|
| 2025 | $7,186 | $769,400 | $261,000 | $508,400 |
| 2024 | $6,316 | $736,100 | $261,000 | $475,100 |
| 2023 | $5,552 | $609,400 | $258,300 | $351,100 |
| 2022 | $5,075 | $456,800 | $165,400 | $291,400 |
| 2021 | $4,938 | $421,300 | $175,800 | $245,500 |
| 2020 | $4,963 | $409,500 | $186,100 | $223,400 |
| 2019 | $4,826 | $393,000 | $196,500 | $196,500 |
| 2018 | $4,494 | $362,700 | $195,900 | $166,800 |
| 2017 | $4,403 | $359,700 | $201,400 | $158,300 |
| 2016 | $4,332 | $361,300 | $203,000 | $158,300 |
| 2015 | $4,611 | $385,500 | $197,400 | $188,100 |
Source: Public Records
Map
Nearby Homes
- 837 Main St
- 842 Main St
- 12 Willow St
- 857 Main St
- 10 Salt Meadow Ln
- 50 Willow St
- 15 Willow St
- 0 Salt Meadow Ln
- 35 Soft Shell Ln
- 66 Willow St
- 866 Main Street Rt 6a
- 780 Main St
- 866 Main St
- 866 Massachusetts 6a
- 35 Softshell Ln
- 881 Main St
- 881 Route 6a
- 35 Willow St
- 881 Main (Route 6a) St
- 881 Main Rte 6a St
Your Personal Tour Guide
Ask me questions while you tour the home.