O
Seller's Agent in 2015
OUTSIDE AGENT
OTHER
208 in this area
5,739 Total Sales
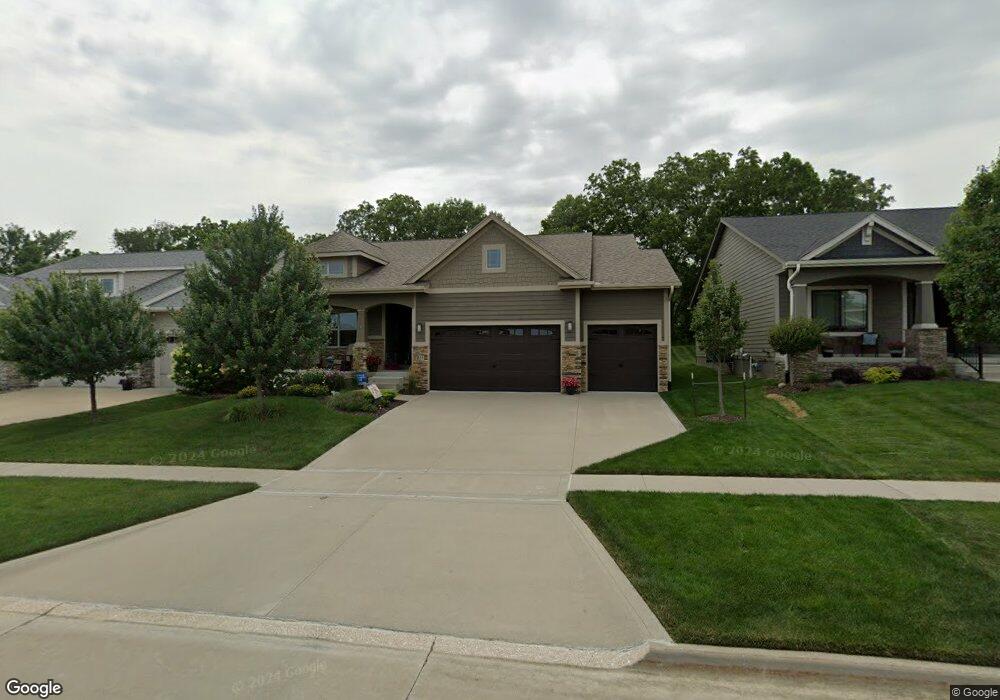
Estimated Value: $484,000 - $544,000
24 Hour Sale
| Date | Buyer | Sale Price | Title Company |
|---|---|---|---|
| Hurley James | $364,500 | None Available | |
| Drake Companies Llc | $69,000 | None Available |
| Date | Status | Borrower | Loan Amount |
|---|---|---|---|
| Open | Hurley James | $286,310 | |
| Previous Owner | Drake Companies Llc | $276,000 |
| Date | Event | Price | Change | Sq Ft Price |
|---|---|---|---|---|
| 07/03/2015 07/03/15 | Sold | $346,650 | 0.0% | $217 / Sq Ft |
| 07/01/2015 07/01/15 | Pending | -- | -- | -- |
| 02/26/2015 02/26/15 | For Sale | $346,650 | -- | $217 / Sq Ft |
| Year | Tax Paid | Tax Assessment Tax Assessment Total Assessment is a certain percentage of the fair market value that is determined by local assessors to be the total taxable value of land and additions on the property. | Land | Improvement |
|---|---|---|---|---|
| 2024 | $7,602 | $481,080 | $75,000 | $406,080 |
| 2023 | $7,602 | $481,080 | $75,000 | $406,080 |
| 2022 | $6,942 | $421,660 | $75,000 | $346,660 |
| 2021 | $6,942 | $390,950 | $75,000 | $315,950 |
| 2020 | $7,144 | $389,360 | $75,000 | $314,360 |
| 2019 | $7,382 | $389,360 | $75,000 | $314,360 |
| 2018 | $7,382 | $383,370 | $75,000 | $308,370 |
| 2017 | $6,756 | $357,100 | $75,000 | $282,100 |
| 2016 | $0 | $343,660 | $75,000 | $268,660 |
O
Seller's Agent in 2015
OUTSIDE AGENT
OTHER
208 in this area
5,739 Total Sales

Buyer's Agent in 2015
Les Sulgrove
VIA Group, REALTORS
(515) 202-8954
5 in this area
32 Total Sales
Source: Des Moines Area Association of REALTORS®
MLS Number: 449448
APN: 16-15-453-003
Disclaimer: Certain information contained herein is derived from information provided by parties other than Homes.com. All information provided is deemed reliable, but is not guaranteed to be accurate and should be independently verified.
![]() IDX information is provided exclusively for personal, non-commercial use, and may not be used for any purpose other than to identify prospective properties consumers may be interested in purchasing. Information is deemed reliable but not guaranteed.
IDX information is provided exclusively for personal, non-commercial use, and may not be used for any purpose other than to identify prospective properties consumers may be interested in purchasing. Information is deemed reliable but not guaranteed.