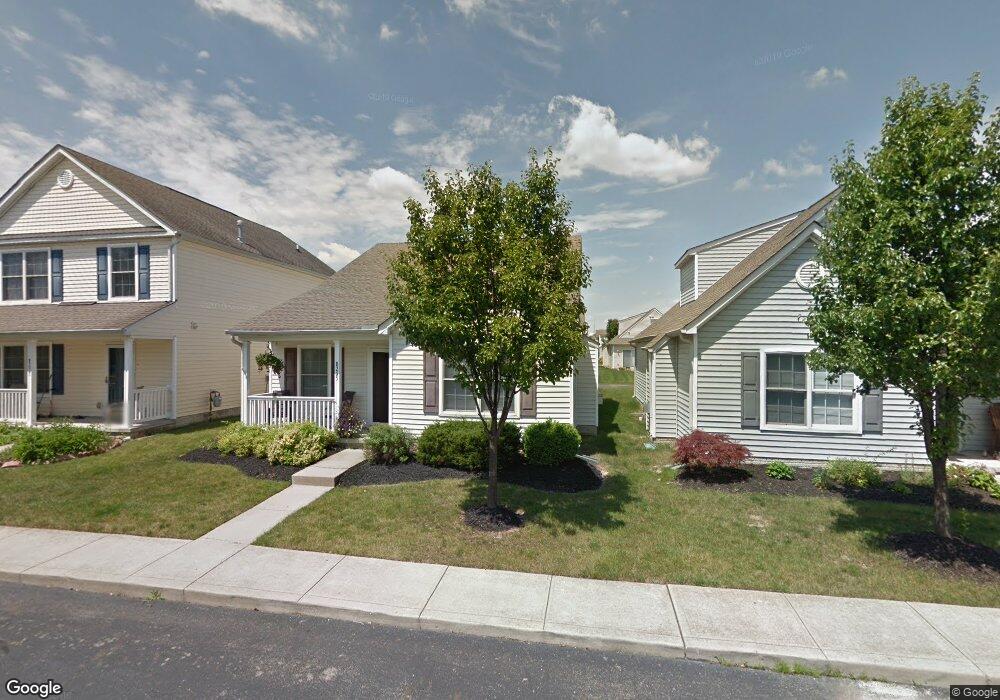
8255 Sirius St Unit 133 Columbus, OH 43240
Polaris South NeighborhoodEstimated Value: $324,000 - $348,000
3
Beds
3
Baths
1,350
Sq Ft
$247/Sq Ft
Est. Value
About This Home
This home is located at 8255 Sirius St Unit 133, Columbus, OH 43240 and is currently estimated at $333,859, approximately $247 per square foot. 8255 Sirius St Unit 133 is a home located in Delaware County with nearby schools including Olentangy Meadows Elementary School, Olentangy Orange Middle School, and Orange High School.
Ownership History
Date
Name
Owned For
Owner Type
Purchase Details
Closed on
May 24, 2017
Sold by
Close Adam M and Close Adam
Bought by
Xiao Osbert
Current Estimated Value
Home Financials for this Owner
Home Financials are based on the most recent Mortgage that was taken out on this home.
Original Mortgage
$94,000
Outstanding Balance
$47,486
Interest Rate
3.27%
Mortgage Type
New Conventional
Estimated Equity
$286,373
Purchase Details
Closed on
Jul 25, 2007
Sold by
Shirley Chad
Bought by
Close Adam and Close Adam M
Home Financials for this Owner
Home Financials are based on the most recent Mortgage that was taken out on this home.
Original Mortgage
$146,300
Interest Rate
6.73%
Mortgage Type
Purchase Money Mortgage
Purchase Details
Closed on
Dec 8, 2004
Sold by
Dominion Homes Inc
Bought by
Shirley Chad
Home Financials for this Owner
Home Financials are based on the most recent Mortgage that was taken out on this home.
Original Mortgage
$131,340
Interest Rate
4.12%
Mortgage Type
Purchase Money Mortgage
Create a Home Valuation Report for This Property
The Home Valuation Report is an in-depth analysis detailing your home's value as well as a comparison with similar homes in the area
Home Values in the Area
Average Home Value in this Area
Purchase History
| Date | Buyer | Sale Price | Title Company |
|---|---|---|---|
| Xiao Osbert | $156,700 | None Available | |
| Close Adam | $154,000 | Title Search Sers | |
| Shirley Chad | $164,800 | Alliance Title |
Source: Public Records
Mortgage History
| Date | Status | Borrower | Loan Amount |
|---|---|---|---|
| Open | Xiao Osbert | $94,000 | |
| Previous Owner | Close Adam | $146,300 | |
| Previous Owner | Shirley Chad | $131,340 | |
| Closed | Shirley Chad | $32,835 |
Source: Public Records
Tax History Compared to Growth
Tax History
| Year | Tax Paid | Tax Assessment Tax Assessment Total Assessment is a certain percentage of the fair market value that is determined by local assessors to be the total taxable value of land and additions on the property. | Land | Improvement |
|---|---|---|---|---|
| 2024 | $4,791 | $86,070 | $17,500 | $68,570 |
| 2023 | $4,808 | $86,070 | $17,500 | $68,570 |
| 2022 | $4,516 | $65,800 | $13,650 | $52,150 |
| 2021 | $4,542 | $65,800 | $13,650 | $52,150 |
| 2020 | $4,568 | $65,800 | $13,650 | $52,150 |
| 2019 | $3,498 | $52,220 | $10,500 | $41,720 |
| 2018 | $3,514 | $52,220 | $10,500 | $41,720 |
| 2017 | $3,478 | $45,920 | $8,750 | $37,170 |
| 2016 | $3,291 | $45,920 | $8,750 | $37,170 |
| 2015 | $3,015 | $45,920 | $8,750 | $37,170 |
| 2014 | $3,059 | $45,920 | $8,750 | $37,170 |
| 2013 | $3,291 | $48,300 | $8,750 | $39,550 |
Source: Public Records
Map
Nearby Homes
- 8293 Mira St Unit 175
- 8133 Worthington Crossing Dr
- 953 Arcadia Blvd
- 1296 Blacksmith Dr
- 1193 Hollytree Ln Unit 1193
- 7940 Schoolside Dr
- 8361 Sable Crossing Dr Unit 8361
- 8321 Sable Crossing Dr
- 1113 Green Knoll Dr Unit 1113
- 893 Maebelle Way
- 369 Windcroft Dr
- 7852 Heathcock Ct
- 7916 Sudeley Ct
- 1212 Tillicum Dr
- 1291 Worthington Creek Dr Unit 7
- 889 Pelham Ct
- 1026 Snohomish Ave
- 774 W Main St
- 1627 Bristol Commons Place
- 3138 E Powell Rd
- 8251 Sirius St Unit 132
- 8271 Sirius St Unit 137
- 8259 Sirius St Unit 134
- 8247 Sirius St Unit 131
- 8263 Sirius St Unit 135
- 8267 Sirius St Unit 136
- 8260 Sirius St Unit 127
- 8256 Sirius St Unit 126
- 8252 Sirius St Unit 125
- 8254 Mira St Unit 160
- 8250 Mira St Unit 161
- 8258 Mira St Unit 159
- 8248 Sirius St
- 8264 Sirius St Unit 123
- 8246 Mira St Unit 162
- 8262 Mira St Unit 158
- 8268 Sirius St Unit 129
- 1581 Sarin St Unit 75
- 8266 Mira St Unit 157
- 1577 Sarin St Unit 74