8256 Linblake Ct Manassas, VA 20111
Estimated Value: $520,000 - $559,000
3
Beds
4
Baths
2,148
Sq Ft
$252/Sq Ft
Est. Value
About This Home
This home is located at 8256 Linblake Ct, Manassas, VA 20111 and is currently estimated at $541,356, approximately $252 per square foot. 8256 Linblake Ct is a home located in Prince William County with nearby schools including Signal Hill Elementary School, Parkside Middle School, and Osbourn Park High School.
Ownership History
Date
Name
Owned For
Owner Type
Purchase Details
Closed on
Aug 26, 2019
Sold by
Tseggai Dawit and Segid Asmerat T
Bought by
Segid Asmerat T
Current Estimated Value
Home Financials for this Owner
Home Financials are based on the most recent Mortgage that was taken out on this home.
Original Mortgage
$214,000
Outstanding Balance
$188,209
Interest Rate
3.8%
Mortgage Type
New Conventional
Estimated Equity
$353,147
Purchase Details
Closed on
Nov 3, 2009
Sold by
K Hovnanian Homes Of Virginia Inc
Bought by
Tseggai Dawit
Home Financials for this Owner
Home Financials are based on the most recent Mortgage that was taken out on this home.
Original Mortgage
$245,000
Interest Rate
5.06%
Mortgage Type
New Conventional
Create a Home Valuation Report for This Property
The Home Valuation Report is an in-depth analysis detailing your home's value as well as a comparison with similar homes in the area
Home Values in the Area
Average Home Value in this Area
Purchase History
| Date | Buyer | Sale Price | Title Company |
|---|---|---|---|
| Segid Asmerat T | -- | Bridgetrust Title Group | |
| Tseggai Dawit | $275,000 | Founders Title Agency Inc |
Source: Public Records
Mortgage History
| Date | Status | Borrower | Loan Amount |
|---|---|---|---|
| Open | Segid Asmerat T | $214,000 | |
| Closed | Tseggai Dawit | $245,000 |
Source: Public Records
Tax History
| Year | Tax Paid | Tax Assessment Tax Assessment Total Assessment is a certain percentage of the fair market value that is determined by local assessors to be the total taxable value of land and additions on the property. | Land | Improvement |
|---|---|---|---|---|
| 2025 | $4,477 | $483,600 | $131,200 | $352,400 |
| 2024 | $4,477 | $450,200 | $124,800 | $325,400 |
| 2023 | $4,658 | $447,700 | $123,500 | $324,200 |
| 2022 | $4,375 | $386,400 | $106,000 | $280,400 |
| 2021 | $4,363 | $356,600 | $98,100 | $258,500 |
| 2020 | $5,217 | $336,600 | $94,300 | $242,300 |
| 2019 | $4,952 | $319,500 | $91,500 | $228,000 |
| 2018 | $3,738 | $309,600 | $90,700 | $218,900 |
| 2017 | $3,757 | $303,700 | $88,600 | $215,100 |
| 2016 | $3,627 | $295,800 | $86,000 | $209,800 |
| 2015 | $3,637 | $290,800 | $85,000 | $205,800 |
| 2014 | $3,637 | $290,300 | $84,900 | $205,400 |
Source: Public Records
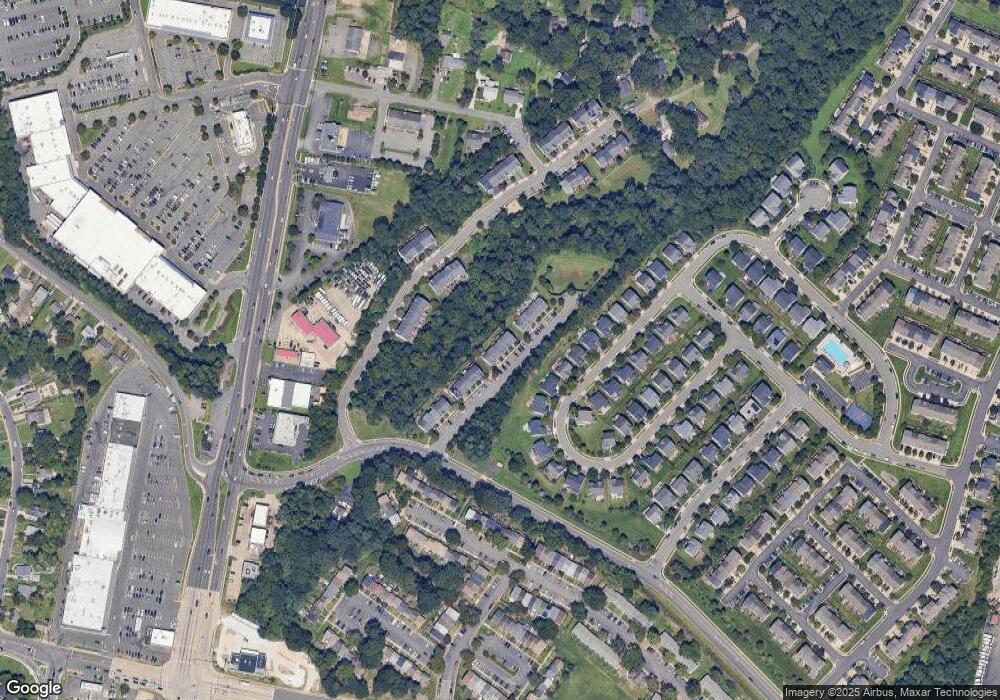
Map
Nearby Homes
- 8270 Linblake Ct
- 122 Scott Dr
- 105 Crozet St
- 8516 Sandstone Way
- 504 Tassita Ln
- 167 Scott Dr
- 145 Manassas Dr
- 156 Manassas Dr
- 1101B Dabney Dr
- The Tessa Plan at Village at Manassas Park
- The Julianne Plan at Village at Manassas Park
- 1105B Dabney Dr
- 8110 Spruce St
- 1110B Dabney Dr
- 1108B Dabney Dr
- 1114A Dabney Dr
- 1107B Dabney Dr
- 1103B Dabney Dr
- 1103A Dabney Dr
- 1110A Dabney Dr
- 8254 Linblake Ct
- 8258 Linblake Ct
- 8252 Linblake Ct
- 8260 Linblake Ct
- 8248 Linblake Ct
- 8264 Linblake Ct
- 8246 Linblake Ct
- 8266 Linblake Ct
- 8244 Linblake Ct
- 8268 Linblake Ct
- 8242 Linblake Ct
- 8240 Linblake Ct
- 8061 Towering Oak Way
- 8272 Linblake Ct
- 8331 Leighlex Ct
- 8065 Towering Oak Way
- 8057 Towering Oak Way
- 8276 Linblake Ct
- 8069 Towering Oak Way
- 8278 Linblake Ct
Your Personal Tour Guide
Ask me questions while you tour the home.