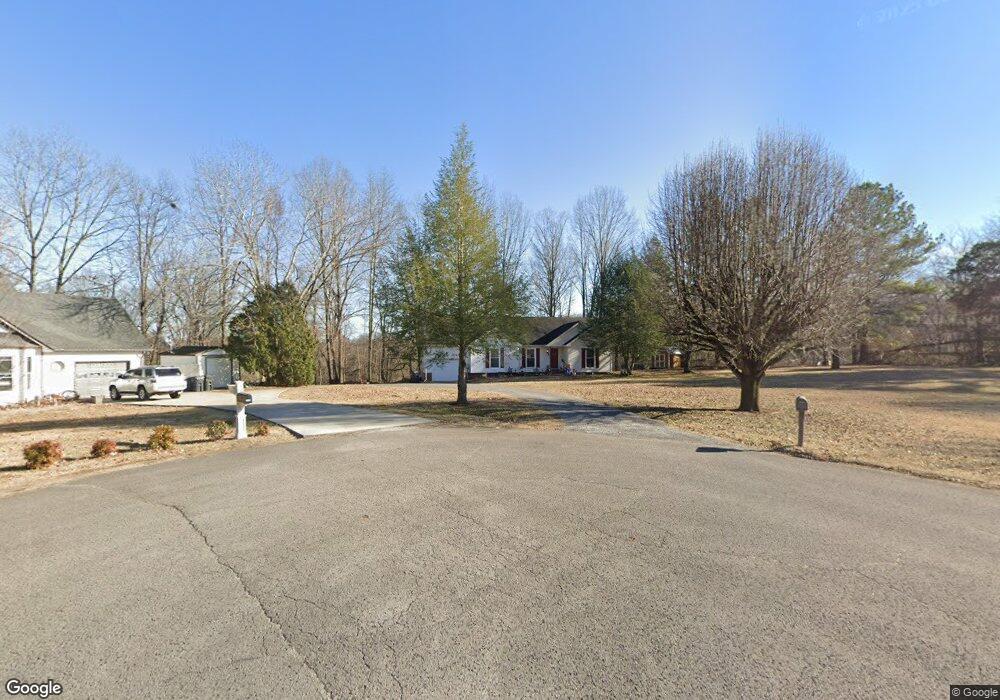
8257 Brownstone Extension Cross Plains, TN 37049
Estimated Value: $262,422 - $364,000
--
Bed
2
Baths
1,346
Sq Ft
$244/Sq Ft
Est. Value
About This Home
This home is located at 8257 Brownstone Extension, Cross Plains, TN 37049 and is currently estimated at $328,606, approximately $244 per square foot. 8257 Brownstone Extension is a home located in Robertson County with nearby schools including East Robertson Elementary School and East Robertson High School.
Ownership History
Date
Name
Owned For
Owner Type
Purchase Details
Closed on
Feb 10, 2017
Sold by
Vance Leonard L
Bought by
Vance Joyce A
Current Estimated Value
Purchase Details
Closed on
Mar 2, 2004
Sold by
Harrell Donna M
Bought by
Vance Joyce A and Vance Leonard L
Home Financials for this Owner
Home Financials are based on the most recent Mortgage that was taken out on this home.
Original Mortgage
$102,230
Interest Rate
5.63%
Purchase Details
Closed on
Jan 25, 1994
Bought by
Harrell Patrick A and Harrell Donna M
Purchase Details
Closed on
Jan 15, 1992
Bought by
Lee David W
Purchase Details
Closed on
Sep 26, 1988
Bought by
Lee David W and Lee Reid E
Purchase Details
Closed on
Feb 25, 1987
Bought by
Faulkner Charles A
Create a Home Valuation Report for This Property
The Home Valuation Report is an in-depth analysis detailing your home's value as well as a comparison with similar homes in the area
Home Values in the Area
Average Home Value in this Area
Purchase History
| Date | Buyer | Sale Price | Title Company |
|---|---|---|---|
| Vance Joyce A | -- | -- | |
| Vance Joyce A | $125,900 | -- | |
| Harrell Patrick A | $83,800 | -- | |
| Lee David W | -- | -- | |
| Lee David W | -- | -- | |
| Faulkner Charles A | -- | -- |
Source: Public Records
Mortgage History
| Date | Status | Borrower | Loan Amount |
|---|---|---|---|
| Previous Owner | Faulkner Charles A | $102,230 |
Source: Public Records
Tax History Compared to Growth
Tax History
| Year | Tax Paid | Tax Assessment Tax Assessment Total Assessment is a certain percentage of the fair market value that is determined by local assessors to be the total taxable value of land and additions on the property. | Land | Improvement |
|---|---|---|---|---|
| 2025 | -- | $57,650 | $0 | $0 |
| 2024 | -- | $57,650 | $10,625 | $47,025 |
| 2023 | $1,038 | $57,650 | $10,625 | $47,025 |
| 2022 | $1,003 | $38,950 | $4,375 | $34,575 |
| 2021 | $1,003 | $38,950 | $4,375 | $34,575 |
| 2020 | $1,003 | $38,950 | $4,375 | $34,575 |
| 2019 | $1,003 | $38,950 | $4,375 | $34,575 |
| 2018 | $1,003 | $38,950 | $4,375 | $34,575 |
| 2017 | $847 | $27,450 | $4,250 | $23,200 |
| 2016 | $847 | $27,450 | $4,250 | $23,200 |
| 2015 | $813 | $27,450 | $4,250 | $23,200 |
| 2014 | $813 | $27,450 | $4,250 | $23,200 |
Source: Public Records
Map
Nearby Homes
- 8265 Guthrie Rd
- 4359 Brownstone Dr
- 1059 Melvin Dr
- 1138 Melvin Dr
- 8288 Guthrie Rd
- 8338 Guthrie Rd
- 82 Deer Run Rd
- 8935 Cedar Grove Rd
- 4675 Wills Rd
- 1033 Valleydale Ave
- 0 Highway 25 Unit RTC3033551
- 0 Highway 25 Unit RTC3043221
- 6400 Williams Rd
- 116 Bradley Ln
- 223 Raymond Hodges Rd
- 4628 Hwy 31w
- 320 Spring Valley Dr
- 358 Spring Valley Dr
- 7870 Mill Rd
- 301 Old Highway 31 W
- 8258 Brownstone Extension
- 8334 Solar Ave
- 8253 Brownstone Extension
- 8254 Brownstone Extension
- 8336 Solar Ave
- 8250 Brownstone Extension
- 8243 Brownstone Extension
- 8322 Solar Ave
- 8244 Brownstone Extension
- 8239 Brownstone Extension
- 8238 Brownstone Extension
- 8323 Solar Ave
- 8316 Solar Ave
- 8235 Brownstone Extension
- 8234 Brownstone Extension
- 8230 Brownstone Extension
- 8225 Westside Dr
- 4419 Westside Dr
- 8318 Morningview Dr
- 8302 Solar Ave