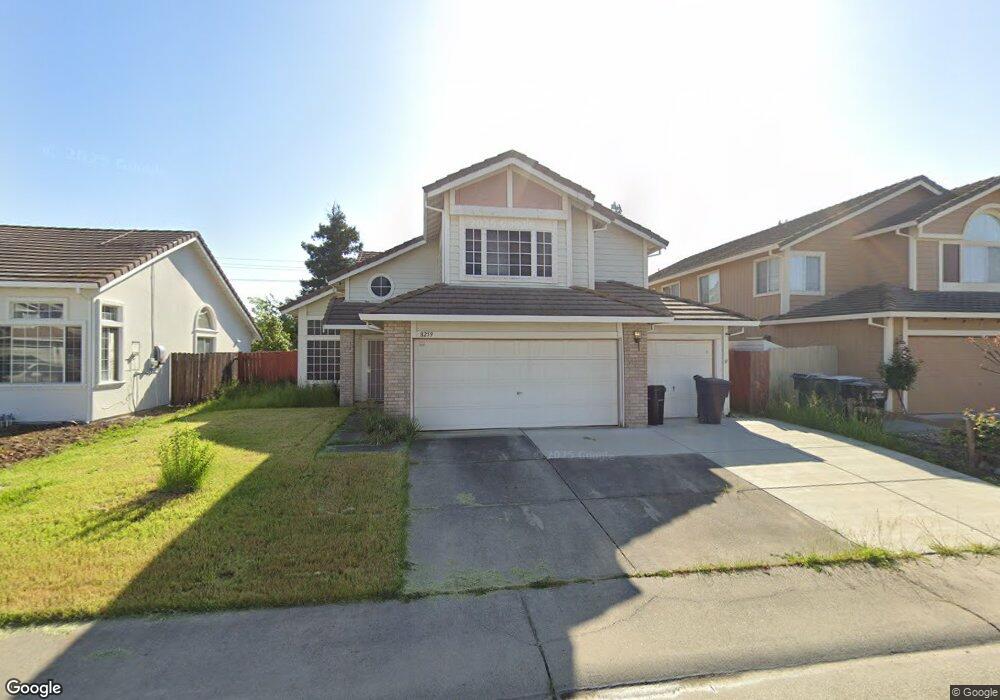
8259 Gwinhurst Cir Sacramento, CA 95828
Estimated Value: $353,000 - $601,000
4
Beds
3
Baths
1,947
Sq Ft
$268/Sq Ft
Est. Value
About This Home
This home is located at 8259 Gwinhurst Cir, Sacramento, CA 95828 and is currently estimated at $521,181, approximately $267 per square foot. 8259 Gwinhurst Cir is a home located in Sacramento County with nearby schools including Raymond Case Elementary School, Edward Harris Jr. Middle School, and Monterey Trail High School.
Ownership History
Date
Name
Owned For
Owner Type
Purchase Details
Closed on
Feb 9, 2021
Sold by
Ortiz Lucy G and Lucy Ortiz Trust
Bought by
Bursiaga Christina D and Bursiaga Manuel A
Current Estimated Value
Purchase Details
Closed on
Oct 2, 2014
Sold by
Amaro Lucy G and Ortiz Lucy G
Bought by
Ortiz Lucy G and Lucy Ortiz Trust
Purchase Details
Closed on
Mar 11, 2002
Sold by
Amaro Robert H
Bought by
Amaro Lucy G
Home Financials for this Owner
Home Financials are based on the most recent Mortgage that was taken out on this home.
Original Mortgage
$150,000
Interest Rate
6.85%
Purchase Details
Closed on
Mar 5, 2002
Sold by
Va
Bought by
Amaro Robert H and Amaro Lucy G
Home Financials for this Owner
Home Financials are based on the most recent Mortgage that was taken out on this home.
Original Mortgage
$150,000
Interest Rate
6.85%
Create a Home Valuation Report for This Property
The Home Valuation Report is an in-depth analysis detailing your home's value as well as a comparison with similar homes in the area
Home Values in the Area
Average Home Value in this Area
Purchase History
| Date | Buyer | Sale Price | Title Company |
|---|---|---|---|
| Bursiaga Christina D | -- | None Available | |
| Bursiaga Christina D | -- | None Listed On Document | |
| Ortiz Lucy G | -- | None Available | |
| Amaro Lucy G | -- | Chicago Title Co | |
| Amaro Robert H | -- | -- |
Source: Public Records
Mortgage History
| Date | Status | Borrower | Loan Amount |
|---|---|---|---|
| Previous Owner | Amaro Lucy G | $150,000 |
Source: Public Records
Tax History Compared to Growth
Tax History
| Year | Tax Paid | Tax Assessment Tax Assessment Total Assessment is a certain percentage of the fair market value that is determined by local assessors to be the total taxable value of land and additions on the property. | Land | Improvement |
|---|---|---|---|---|
| 2025 | $3,552 | $317,148 | $86,793 | $230,355 |
| 2024 | $3,552 | $310,931 | $85,092 | $225,839 |
| 2023 | $3,465 | $304,835 | $83,424 | $221,411 |
| 2022 | $3,408 | $298,859 | $81,789 | $217,070 |
| 2021 | $3,372 | $293,000 | $80,186 | $212,814 |
| 2020 | $3,328 | $289,996 | $79,364 | $210,632 |
| 2019 | $3,270 | $284,310 | $77,808 | $206,502 |
| 2018 | $3,185 | $278,736 | $76,283 | $202,453 |
| 2017 | $3,132 | $273,272 | $74,788 | $198,484 |
| 2016 | $2,979 | $267,915 | $73,322 | $194,593 |
| 2015 | $2,925 | $263,892 | $72,221 | $191,671 |
| 2014 | $2,878 | $258,724 | $70,807 | $187,917 |
Source: Public Records
Map
Nearby Homes
- 8216 Exbourne Cir
- 8159 Morgan Hill Way
- 8233 Short Rd
- 8170 Derbyshire Cir
- 8772 Crusheen Way
- 8247 Derbyshire Cir
- 8578 Hydrangea Ct
- 8836 Inisheer Way
- 8447 Cassatt Way
- 8831 Liscarney Way
- 8437 Yermo Way
- 8716 Cord Way
- 8034 Kelty Ct
- 8902 Cobble Crest Dr
- 8329 Spengler Dr
- 8510 Cavendish Way
- 8916 Hollowstone Way
- 8317 Honeycomb Way
- 8336 Cutler Way
- 8762 Lemas Rd
- 8263 Gwinhurst Cir
- 8255 Gwinhurst Cir
- 8267 Gwinhurst Cir
- 8251 Gwinhurst Cir
- 8258 Gwinhurst Cir
- 8262 Gwinhurst Cir
- 8254 Gwinhurst Cir
- 8271 Gwinhurst Cir
- 8247 Gwinhurst Cir
- 8266 Gwinhurst Cir
- 8250 Gwinhurst Cir
- 8270 Gwinhurst Cir
- 8275 Gwinhurst Cir
- 8243 Gwinhurst Cir
- 8241 Hardester Dr
- 8245 Hardester Dr
- 8237 Hardester Dr
- 8274 Gwinhurst Cir
- 8249 Hardester Dr
- 8279 Gwinhurst Cir