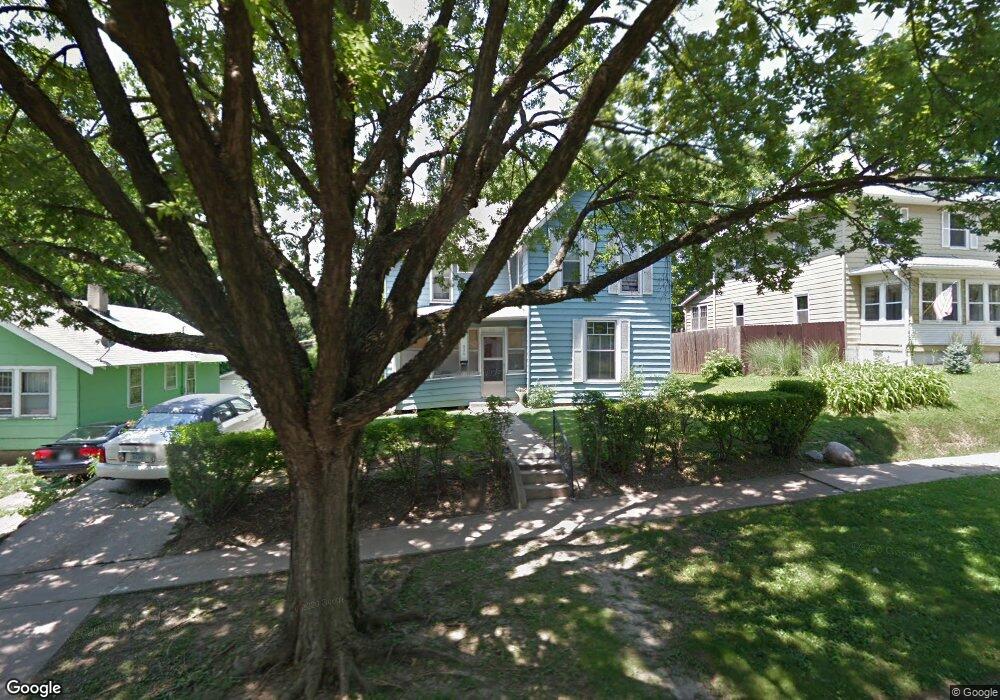
826 25th St Des Moines, IA 50312
Woodland Heights NeighborhoodEstimated Value: $107,000 - $219,000
3
Beds
1
Bath
1,312
Sq Ft
$122/Sq Ft
Est. Value
About This Home
This home is located at 826 25th St, Des Moines, IA 50312 and is currently estimated at $159,892, approximately $121 per square foot. 826 25th St is a home located in Polk County with nearby schools including Greenwood Elementary School, Callanan Middle School, and Roosevelt High School.
Ownership History
Date
Name
Owned For
Owner Type
Purchase Details
Closed on
Aug 6, 2025
Sold by
Green Mt Llc
Bought by
Sell My House Dsm Llc
Current Estimated Value
Home Financials for this Owner
Home Financials are based on the most recent Mortgage that was taken out on this home.
Original Mortgage
$159,000
Outstanding Balance
$158,864
Interest Rate
6.77%
Mortgage Type
Construction
Estimated Equity
$1,028
Create a Home Valuation Report for This Property
The Home Valuation Report is an in-depth analysis detailing your home's value as well as a comparison with similar homes in the area
Home Values in the Area
Average Home Value in this Area
Purchase History
| Date | Buyer | Sale Price | Title Company |
|---|---|---|---|
| Sell My House Dsm Llc | $110,000 | None Listed On Document | |
| Sell My House Dsm Llc | $110,000 | None Listed On Document | |
| Green Mt Llc | $96,000 | None Listed On Document | |
| Green Mt Llc | $96,000 | None Listed On Document |
Source: Public Records
Mortgage History
| Date | Status | Borrower | Loan Amount |
|---|---|---|---|
| Open | Sell My House Dsm Llc | $159,000 | |
| Closed | Sell My House Dsm Llc | $159,000 |
Source: Public Records
Tax History
| Year | Tax Paid | Tax Assessment Tax Assessment Total Assessment is a certain percentage of the fair market value that is determined by local assessors to be the total taxable value of land and additions on the property. | Land | Improvement |
|---|---|---|---|---|
| 2025 | $2,632 | $170,800 | $34,100 | $136,700 |
| 2024 | $2,632 | $151,300 | $30,000 | $121,300 |
| 2023 | $2,616 | $151,300 | $30,000 | $121,300 |
| 2022 | $2,594 | $119,900 | $24,500 | $95,400 |
| 2021 | $2,440 | $119,900 | $24,500 | $95,400 |
| 2020 | $2,530 | $106,400 | $21,800 | $84,600 |
| 2019 | $2,284 | $106,400 | $21,800 | $84,600 |
| 2018 | $2,256 | $93,500 | $19,000 | $74,500 |
| 2017 | $2,180 | $93,500 | $19,000 | $74,500 |
| 2016 | $2,118 | $89,100 | $18,000 | $71,100 |
| 2015 | $2,118 | $89,100 | $18,000 | $71,100 |
| 2014 | $1,892 | $82,800 | $16,700 | $66,100 |
Source: Public Records
Map
Nearby Homes
Your Personal Tour Guide
Ask me questions while you tour the home.