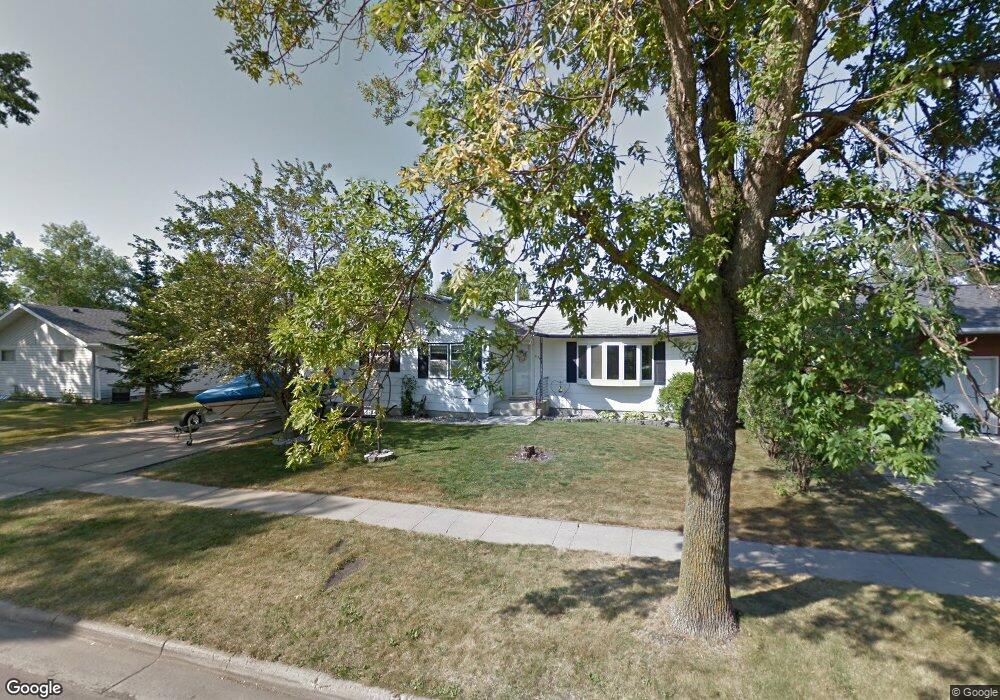
826 3rd St E West Fargo, ND 58078
Eastwood NeighborhoodEstimated Value: $294,000
4
Beds
2
Baths
1,040
Sq Ft
$283/Sq Ft
Est. Value
About This Home
This home is located at 826 3rd St E, West Fargo, ND 58078 and is currently estimated at $294,000, approximately $282 per square foot. 826 3rd St E is a home located in Cass County with nearby schools including Eastwood Elementary School, Cheney Middle School, and West Fargo High School.
Ownership History
Date
Name
Owned For
Owner Type
Purchase Details
Closed on
Jan 25, 2012
Sold by
Beets Timothy J and Beets Karen A
Bought by
Beets Timothy J
Current Estimated Value
Create a Home Valuation Report for This Property
The Home Valuation Report is an in-depth analysis detailing your home's value as well as a comparison with similar homes in the area
Home Values in the Area
Average Home Value in this Area
Purchase History
| Date | Buyer | Sale Price | Title Company |
|---|---|---|---|
| Beets Timothy J | -- | None Available |
Source: Public Records
Tax History
| Year | Tax Paid | Tax Assessment Tax Assessment Total Assessment is a certain percentage of the fair market value that is determined by local assessors to be the total taxable value of land and additions on the property. | Land | Improvement |
|---|---|---|---|---|
| 2024 | $600 | $136,750 | $20,150 | $116,600 |
| 2023 | $981 | $131,800 | $20,150 | $111,650 |
| 2022 | $3,435 | $120,250 | $20,150 | $100,100 |
| 2021 | $3,199 | $108,400 | $14,650 | $93,750 |
| 2020 | $3,127 | $108,750 | $14,650 | $94,100 |
| 2019 | $2,939 | $101,850 | $14,650 | $87,200 |
| 2018 | $2,663 | $95,950 | $14,650 | $81,300 |
| 2017 | $2,545 | $93,800 | $14,650 | $79,150 |
| 2016 | $2,249 | $90,650 | $14,650 | $76,000 |
| 2015 | $2,210 | $81,800 | $13,300 | $68,500 |
| 2014 | $2,168 | $76,450 | $13,300 | $63,150 |
| 2013 | $2,204 | $76,450 | $13,300 | $63,150 |
Source: Public Records
Map
Nearby Homes
- 245 12th Ave E
- 431 5th Ave E Unit 1
- 620 Sukut St
- 622 12th Ave E
- 332 13th Ave E
- 226 10 1/2 Ave W
- 431 4th Ave E
- 602 12 1 2 Ave E Unit 5
- 631 7th Ave E
- 706 14th Ave E
- 217 1st Ave E
- 714 14th Ave E
- 520 6th Ave W Unit 8
- 832 5th Ave E
- 612 7th Ave W
- 232 1st Ave W
- 236 1st Ave W
- 801 9th St E
- 783 14 1 2 Ave E
- 901 7th St W
Your Personal Tour Guide
Ask me questions while you tour the home.