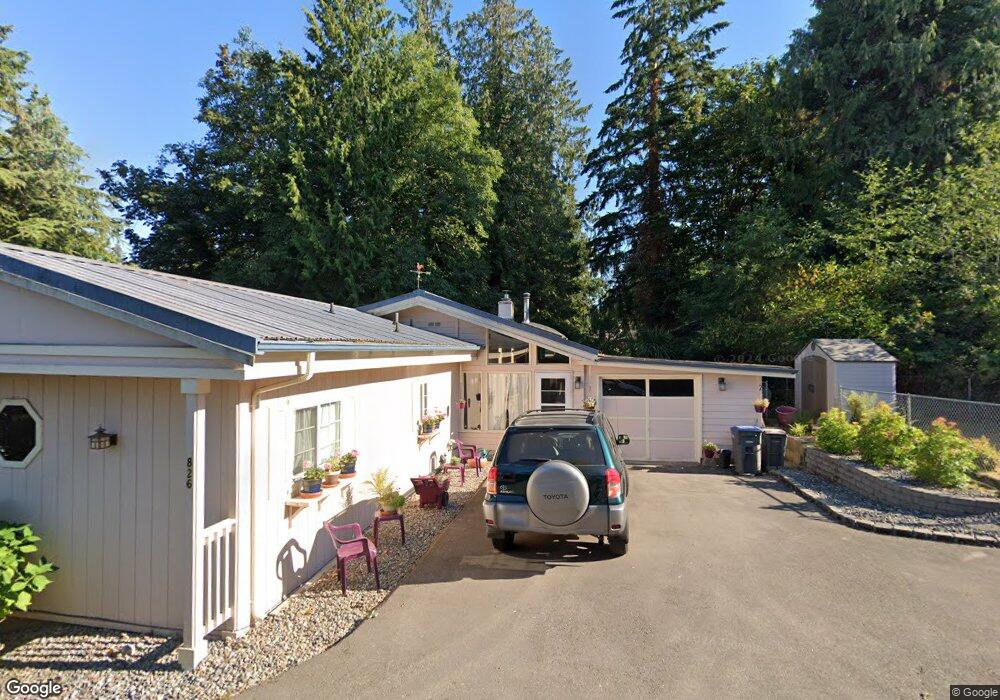
826 Colchester Dr E Port Orchard, WA 98366
Manchester NeighborhoodEstimated Value: $451,860 - $492,000
3
Beds
1
Bath
1,228
Sq Ft
$386/Sq Ft
Est. Value
About This Home
This home is located at 826 Colchester Dr E, Port Orchard, WA 98366 and is currently estimated at $473,965, approximately $385 per square foot. 826 Colchester Dr E is a home located in Kitsap County with nearby schools including Manchester Elementary School, John Sedgwick Middle School, and South Kitsap High School.
Ownership History
Date
Name
Owned For
Owner Type
Purchase Details
Closed on
May 12, 2008
Sold by
Dueber Eugene A
Bought by
Dueber Dorothy Fay
Current Estimated Value
Purchase Details
Closed on
Nov 10, 1997
Sold by
Asbridge Adrienne K and Asbridge Kay
Bought by
Bryant Larry L and Bryant Linda S
Create a Home Valuation Report for This Property
The Home Valuation Report is an in-depth analysis detailing your home's value as well as a comparison with similar homes in the area
Home Values in the Area
Average Home Value in this Area
Purchase History
| Date | Buyer | Sale Price | Title Company |
|---|---|---|---|
| Dueber Dorothy Fay | -- | None Available | |
| Bryant Larry L | -- | Charter Title Corp |
Source: Public Records
Tax History Compared to Growth
Tax History
| Year | Tax Paid | Tax Assessment Tax Assessment Total Assessment is a certain percentage of the fair market value that is determined by local assessors to be the total taxable value of land and additions on the property. | Land | Improvement |
|---|---|---|---|---|
| 2026 | $3,332 | $380,620 | $96,090 | $284,530 |
| 2025 | $3,332 | $380,620 | $96,090 | $284,530 |
| 2024 | $3,231 | $380,620 | $96,090 | $284,530 |
| 2023 | $3,207 | $380,620 | $96,090 | $284,530 |
| 2022 | $3,065 | $304,360 | $76,740 | $227,620 |
| 2021 | $2,827 | $265,300 | $66,730 | $198,570 |
| 2020 | $2,485 | $225,720 | $60,260 | $165,460 |
| 2019 | $2,143 | $213,590 | $57,110 | $156,480 |
| 2018 | $2,241 | $168,600 | $49,560 | $119,040 |
| 2017 | $1,865 | $168,600 | $49,560 | $119,040 |
| 2016 | $1,828 | $151,270 | $47,200 | $104,070 |
| 2015 | $1,767 | $148,280 | $47,200 | $101,080 |
| 2014 | -- | $143,180 | $48,900 | $94,280 |
| 2013 | -- | $143,180 | $48,900 | $94,280 |
Source: Public Records
Map
Nearby Homes
- 8185 E Seaview Dr
- 1129 Colchester Dr SE
- 1129 Colechester Dr S
- 1083 Puget Dr E
- 8009 E Commons Ct
- 1313 Colchester Dr SE
- 7847 SE Monte Bella Place
- 1381 Alaska Ave SE
- 1630 & 1632 Colchester Dr E
- 802 California Ave SE
- 7143 SE Grant St
- 7166 E Fillmore St
- 7549 E Alki View Ct
- 7748 E Hemlock St
- 7104 SE Kansas St
- 2372 Valley Ave E
- 7085 SE Legrand St
- 8079 E Main St Unit 341
- 5 Lots Lilypad Place E
- 2451 Mcgregor Dr SE
- 8356 E Pheasant Hill Ln
- 810 Colchester Dr SE
- 830 Colchester Dr E
- 8161 SE Haida Dr
- 53 Colchester Dr SE
- 8326 E Pheasant Hill Ln
- 8163 SE Haida Dr
- 8325 E Pheasant Hill Ln
- 912 Colchester Dr E
- 912 Colchester Dr SE
- 8159 SE Haida Dr
- 906 Colchester Dr E
- 8166 SE Haida Dr
- 837 Colchester Dr E
- 815 Colchester Dr SE
- 834 Colchester Dr E
- 835 Colchester Dr E
- 861 Colchester Dr SE
- 807 Colchester Dr E
- 8286 E Pheasant Hill Ln