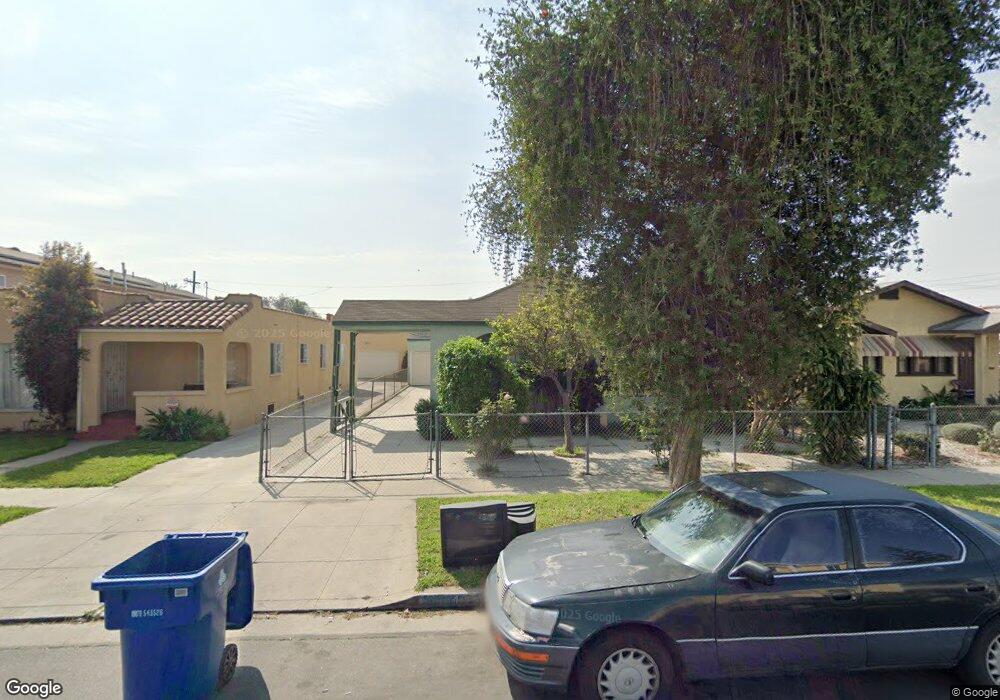
826 E 81st St Los Angeles, CA 90001
Florence NeighborhoodEstimated Value: $647,000 - $788,175
4
Beds
2
Baths
1,512
Sq Ft
$462/Sq Ft
Est. Value
About This Home
This home is located at 826 E 81st St, Los Angeles, CA 90001 and is currently estimated at $697,794, approximately $461 per square foot. 826 E 81st St is a home located in Los Angeles County with nearby schools including McKinley Avenue Elementary School, Charles Drew Middle School, and Academy For Multiligual Arts And Science At Mervyn M. Dymally High.
Ownership History
Date
Name
Owned For
Owner Type
Purchase Details
Closed on
Jan 3, 2020
Sold by
Veneg
Bought by
Veneg
Current Estimated Value
Home Financials for this Owner
Home Financials are based on the most recent Mortgage that was taken out on this home.
Interest Rate
3.72%
Purchase Details
Closed on
Jul 15, 2017
Sold by
Hernandez Irene
Bought by
Venegas Ramiro
Purchase Details
Closed on
Apr 25, 1997
Sold by
Hernandez Javier Perez and Hernandez Irene
Bought by
Perez Javier Hernandez and Hernandez Irene
Create a Home Valuation Report for This Property
The Home Valuation Report is an in-depth analysis detailing your home's value as well as a comparison with similar homes in the area
Home Values in the Area
Average Home Value in this Area
Purchase History
| Date | Buyer | Sale Price | Title Company |
|---|---|---|---|
| Veneg | -- | -- | |
| Venegas Ramiro | -- | None Available | |
| Perez Javier Hernandez | -- | -- | |
| Perez Javier Hernandez | -- | -- |
Source: Public Records
Mortgage History
| Date | Status | Borrower | Loan Amount |
|---|---|---|---|
| Closed | Veneg | -- |
Source: Public Records
Tax History
| Year | Tax Paid | Tax Assessment Tax Assessment Total Assessment is a certain percentage of the fair market value that is determined by local assessors to be the total taxable value of land and additions on the property. | Land | Improvement |
|---|---|---|---|---|
| 2025 | $4,379 | $346,519 | $170,762 | $175,757 |
| 2024 | $4,379 | $339,725 | $167,414 | $172,311 |
| 2023 | $4,298 | $333,065 | $164,132 | $168,933 |
| 2022 | $4,103 | $326,535 | $160,914 | $165,621 |
| 2021 | $4,048 | $320,133 | $157,759 | $162,374 |
| 2020 | $3,275 | $256,296 | $109,834 | $146,462 |
| 2019 | $3,151 | $251,272 | $107,681 | $143,591 |
| 2018 | $3,077 | $246,346 | $105,570 | $140,776 |
| 2016 | $2,927 | $236,781 | $101,471 | $135,310 |
| 2015 | $2,885 | $233,225 | $99,947 | $133,278 |
| 2014 | $2,905 | $228,658 | $97,990 | $130,668 |
Source: Public Records
Map
Nearby Homes
- 759 E 83rd St
- 914 E 83rd St
- 8405 Mckinley Ave
- 912 E 79th St
- 8219 S Central Ave
- 916 E 79th St
- 801 E 84th Place
- 1014 E 84th St
- 742 E 84th Place
- 7916 S Central Ave
- 819 E 85th St
- 1139 E 82nd St
- 923 E 85th St
- 8100 Avalon Blvd
- 620 E 84th St
- 1150 E 80th St
- 911 E 77th St
- 1147 Nadeau St
- 8311 Avalon Blvd
- 1118 E 77th Place
Your Personal Tour Guide
Ask me questions while you tour the home.