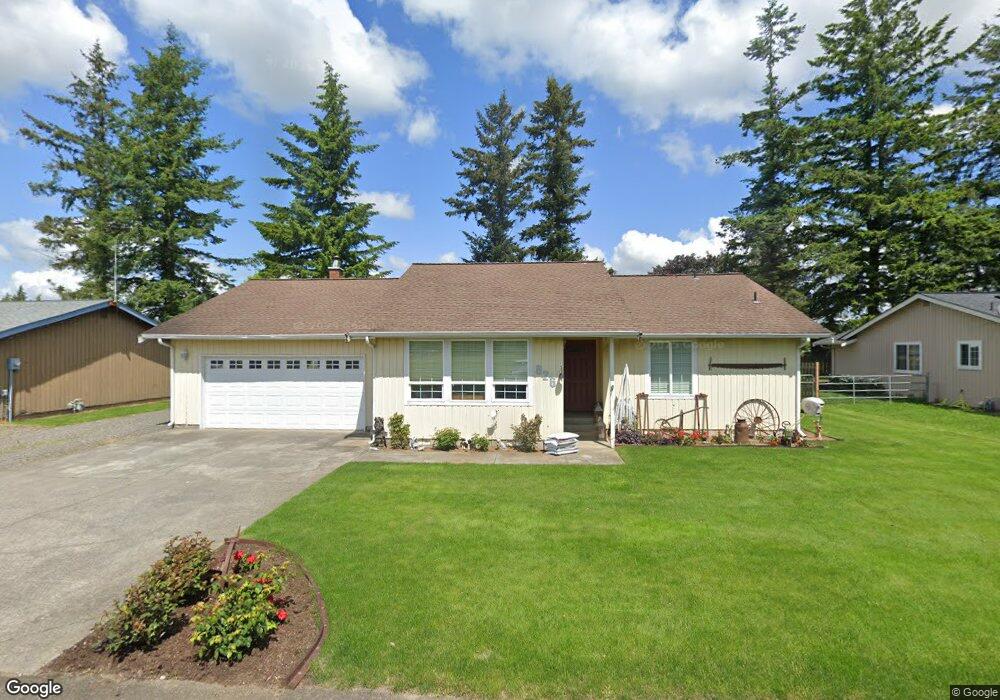
826 Hinotes Ct Lynden, WA 98264
Estimated Value: $542,000 - $633,000
3
Beds
2
Baths
1,508
Sq Ft
$377/Sq Ft
Est. Value
About This Home
This home is located at 826 Hinotes Ct, Lynden, WA 98264 and is currently estimated at $567,821, approximately $376 per square foot. 826 Hinotes Ct is a home located in Whatcom County with nearby schools including Lynden High School, Lynden Christian School, and Lynden Christian Schools: Administration.
Ownership History
Date
Name
Owned For
Owner Type
Purchase Details
Closed on
Sep 1, 2005
Sold by
Cafarella James W and Cafarella Rebecca A
Bought by
Fakkema John A and Fakkema Janice F
Current Estimated Value
Home Financials for this Owner
Home Financials are based on the most recent Mortgage that was taken out on this home.
Original Mortgage
$49,600
Interest Rate
5.22%
Mortgage Type
Stand Alone Second
Purchase Details
Closed on
May 18, 2004
Sold by
Abbe Roger L
Bought by
Cafarella James W and Cafarella Rebecca A
Home Financials for this Owner
Home Financials are based on the most recent Mortgage that was taken out on this home.
Original Mortgage
$138,800
Interest Rate
6.25%
Mortgage Type
Purchase Money Mortgage
Create a Home Valuation Report for This Property
The Home Valuation Report is an in-depth analysis detailing your home's value as well as a comparison with similar homes in the area
Purchase History
| Date | Buyer | Sale Price | Title Company |
|---|---|---|---|
| Fakkema John A | $248,280 | First American Title Insuran | |
| Cafarella James W | $173,500 | First American Title Insuran |
Source: Public Records
Mortgage History
| Date | Status | Borrower | Loan Amount |
|---|---|---|---|
| Closed | Fakkema John A | $49,600 | |
| Open | Fakkema John A | $198,400 | |
| Previous Owner | Cafarella James W | $138,800 | |
| Closed | Cafarella James W | $34,700 |
Source: Public Records
Tax History
| Year | Tax Paid | Tax Assessment Tax Assessment Total Assessment is a certain percentage of the fair market value that is determined by local assessors to be the total taxable value of land and additions on the property. | Land | Improvement |
|---|---|---|---|---|
| 2025 | $4,295 | $543,902 | $257,050 | $286,852 |
| 2024 | $3,952 | $529,352 | $242,500 | $286,852 |
| 2023 | $3,952 | $525,819 | $250,000 | $275,819 |
| 2022 | $3,607 | $448,995 | $162,459 | $286,536 |
| 2021 | $3,541 | $371,066 | $134,262 | $236,804 |
| 2020 | $3,157 | $331,318 | $119,880 | $211,438 |
| 2019 | $2,828 | $303,888 | $110,070 | $193,818 |
| 2018 | $3,077 | $277,118 | $100,269 | $176,849 |
| 2017 | $2,886 | $248,737 | $90,000 | $158,737 |
| 2016 | $2,728 | $248,569 | $79,200 | $169,369 |
| 2015 | $2,432 | $233,464 | $76,176 | $157,288 |
| 2014 | -- | $225,553 | $73,584 | $151,969 |
| 2013 | -- | $223,969 | $72,000 | $151,969 |
Source: Public Records
Map
Nearby Homes
- 6917 Red Ridge Dr
- 6849 Raspberry Dr
- 6778 La Monte Dr
- 6786 La Bello Dr
- 6743 La Bello Dr
- 7343 Hannegan Rd Unit 2
- 7393 Hannegan Rd
- 380 E Pole Rd Unit 13
- 765 van Dyk Rd
- 1375 Ten Mile Rd
- 0 Old Guide Rd
- 6049 Medcalf Rd
- 361 W Wiser Lake Rd
- 7349 Old Guide Rd
- 1822 E Pole Rd
- 1817 Central Rd
- 1594 Farmview Terrace
- 1710 Farmview Terrace
- 1774 Farmview Terrace
- 5774 Denali Ln
- 832 Hinotes Ct
- 820 Hinotes Ct
- 833 Meadowlark Rd
- 833 Meadowlark Dr
- 814 Hinotes Ct
- 827 Meadowlark Dr
- 839 Meadowlark Dr
- 846 Hinotes Ct
- 821 Meadowlark Dr
- 845 Meadowlark Dr
- 808 Hinotes Ct
- 815 Meadowlark Dr
- 851 Meadowlark Dr
- 802 Hinotes Ct
- 809 Meadowlark Dr
- 857 Meadowlark Dr
- 860 Hinotes Ct
- 855 Hinotes Ct
- 863 Meadowlark Dr
- 814 Meadowlark Dr
Your Personal Tour Guide
Ask me questions while you tour the home.