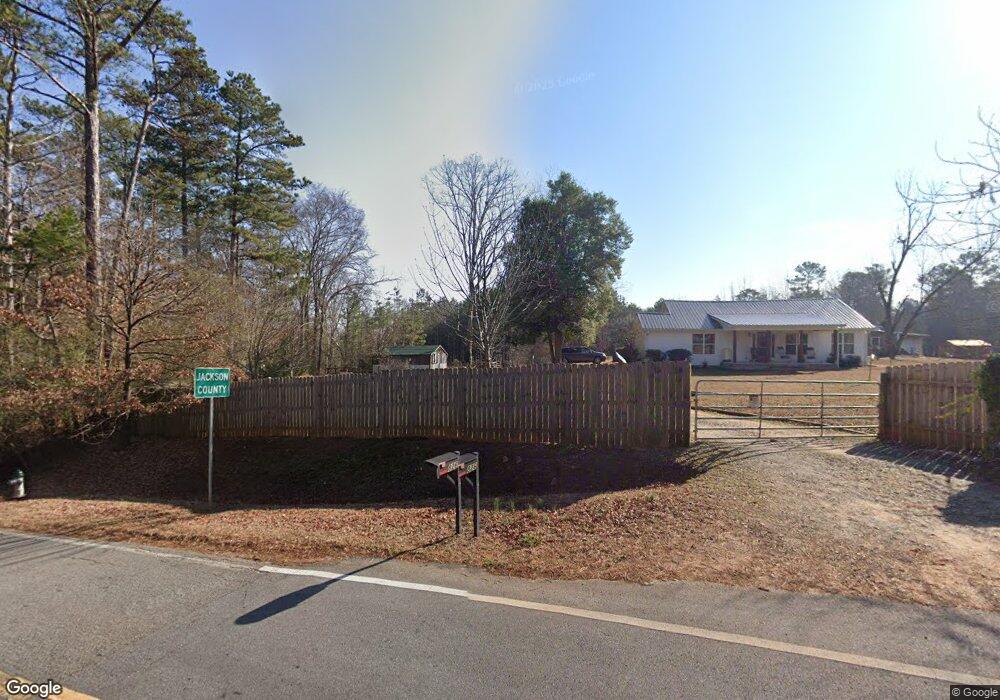
826 John Collier Rd Athens, GA 30607
Estimated Value: $355,000 - $361,000
3
Beds
2
Baths
1,626
Sq Ft
$220/Sq Ft
Est. Value
About This Home
This home is located at 826 John Collier Rd, Athens, GA 30607 and is currently estimated at $357,678, approximately $219 per square foot. 826 John Collier Rd is a home located in Clarke County with nearby schools including Whitehead Road Elementary School, Burney-Harris-Lyons Middle School, and Clarke Central High School.
Ownership History
Date
Name
Owned For
Owner Type
Purchase Details
Closed on
May 18, 2017
Sold by
Mcgee Christine
Bought by
Norwood David A and Norwood Darcy M
Current Estimated Value
Purchase Details
Closed on
Jul 31, 2006
Sold by
Not Provided
Bought by
Mcgee Christine
Home Financials for this Owner
Home Financials are based on the most recent Mortgage that was taken out on this home.
Original Mortgage
$164,850
Interest Rate
5.5%
Mortgage Type
VA
Purchase Details
Closed on
Dec 20, 2002
Sold by
Horne Danny Lee
Bought by
Beam & Associates Inc
Purchase Details
Closed on
Jun 7, 2002
Sold by
Boyd Jean M
Bought by
Horne Danny Lee
Purchase Details
Closed on
May 3, 1993
Sold by
Boyd A B Decd By Turstee Trust Company
Bought by
Boyd Jean M
Purchase Details
Closed on
May 31, 1991
Sold by
Jean Boyd A and Jean Mclendon
Bought by
Boyd A B Decd By Turstee Trust Company
Create a Home Valuation Report for This Property
The Home Valuation Report is an in-depth analysis detailing your home's value as well as a comparison with similar homes in the area
Purchase History
| Date | Buyer | Sale Price | Title Company |
|---|---|---|---|
| Norwood David A | $157,900 | -- | |
| Mcgee Christine | $161,400 | -- | |
| Beam & Associates Inc | $145,000 | -- | |
| Horne Danny Lee | $100,000 | -- | |
| Boyd Jean M | -- | -- | |
| Boyd A B Decd By Turstee Trust Company | $26,000 | -- |
Source: Public Records
Mortgage History
| Date | Status | Borrower | Loan Amount |
|---|---|---|---|
| Previous Owner | Mcgee Christine | $164,850 |
Source: Public Records
Tax History
| Year | Tax Paid | Tax Assessment Tax Assessment Total Assessment is a certain percentage of the fair market value that is determined by local assessors to be the total taxable value of land and additions on the property. | Land | Improvement |
|---|---|---|---|---|
| 2025 | $2,175 | $116,469 | $26,048 | $90,421 |
| 2024 | $2,175 | $107,380 | $22,792 | $84,588 |
| 2023 | $1,157 | $99,362 | $21,164 | $78,198 |
| 2022 | $2,233 | $91,504 | $21,164 | $70,340 |
| 2021 | $2,090 | $72,011 | $17,908 | $54,103 |
| 2020 | $2,033 | $70,334 | $17,908 | $52,426 |
| 2019 | $1,901 | $65,998 | $17,908 | $48,090 |
| 2018 | $1,885 | $65,510 | $17,908 | $47,602 |
| 2017 | $2,052 | $60,456 | $17,908 | $42,548 |
| 2016 | $1,793 | $52,806 | $17,908 | $34,898 |
| 2015 | $1,791 | $52,662 | $17,908 | $34,754 |
| 2014 | $1,806 | $53,040 | $17,908 | $35,132 |
Source: Public Records
Map
Nearby Homes
- 11302 Jefferson Rd
- 0 Jefferson Rd Unit CL345142
- 0 Jefferson Rd Unit 10631273
- 158 Lakeover Dr
- 1175 Lavender Rd
- 390 Lakeland Dr
- 160 Lake Forest Dr
- 139 Lake Forest Dr
- 650 Lakeland Way
- 146 Prospect Church Rd
- 283 Lake Vista Way
- 207 Wisteria Way
- 180 Ramble Hills Cir Unit 180 & 182
- 105 Red Bluff Dr
- 130 Peachtree Ln
- 6 Oak Grove Rd
- 6270 Old Jefferson Rd
- 15 Chestnut Oak Run
- 185 Boundary St
- 413 Jasmine Trail
- 745 John Collier Rd
- 887 John Collier Rd
- 755 John Collier Rd
- 765 John Collier Rd
- 866 Fuller Rd
- 778 John Collier Rd
- 804 Fuller Rd
- 728 John Collier Rd
- 731 Fuller Rd
- 648 John Collier Rd
- 549 John Collier Rd
- 149 Griffeth Rd
- 149 Griffith Rd
- 146 Griffeth Rd
- 463 John Collier Rd
- 108 Griffeth Rd
- 620 Fuller Rd
- 515 John Collier Rd
- 540 John Collier Rd
- 540 John Collier Rd
Your Personal Tour Guide
Ask me questions while you tour the home.